Fig. 3.
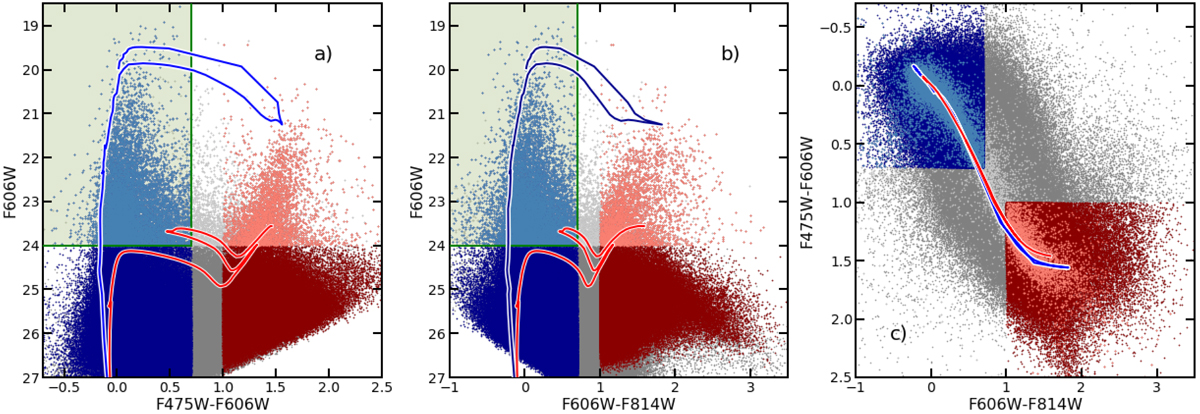
Photometric diagrams from ACS/WFC data. Blue and red indicate adopted blue and red objects, respectively, Light colors indicate the adopted bright ones. Green boxes indicate the considered stars in the PLC method. Blue and red curves are the Parsec 1.2S isochrones corresponding to 10 and 90 Myr, respectively (see text for details).
Current usage metrics show cumulative count of Article Views (full-text article views including HTML views, PDF and ePub downloads, according to the available data) and Abstracts Views on Vision4Press platform.
Data correspond to usage on the plateform after 2015. The current usage metrics is available 48-96 hours after online publication and is updated daily on week days.
Initial download of the metrics may take a while.