Free Access
Fig. 10.
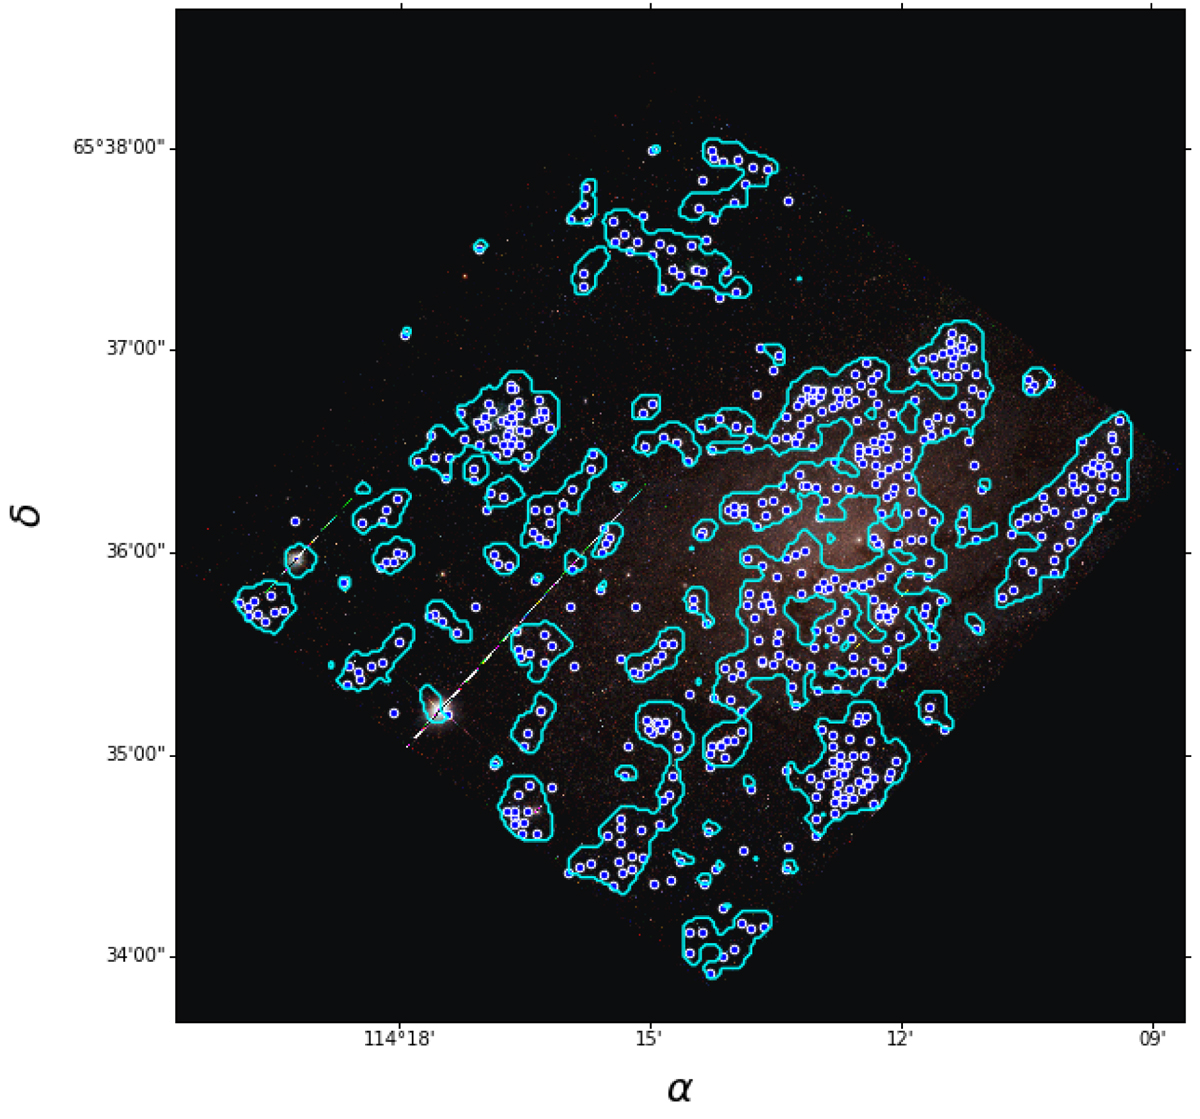
Color image of observed region in NGC 2403. The contours of the structures detected in the density map are shown in light blue. The blue circles are the YSGs detected using the PLC method. We can observe an excellent correlation between YSGs and larger structures.
Current usage metrics show cumulative count of Article Views (full-text article views including HTML views, PDF and ePub downloads, according to the available data) and Abstracts Views on Vision4Press platform.
Data correspond to usage on the plateform after 2015. The current usage metrics is available 48-96 hours after online publication and is updated daily on week days.
Initial download of the metrics may take a while.