Free Access
Fig. 4.
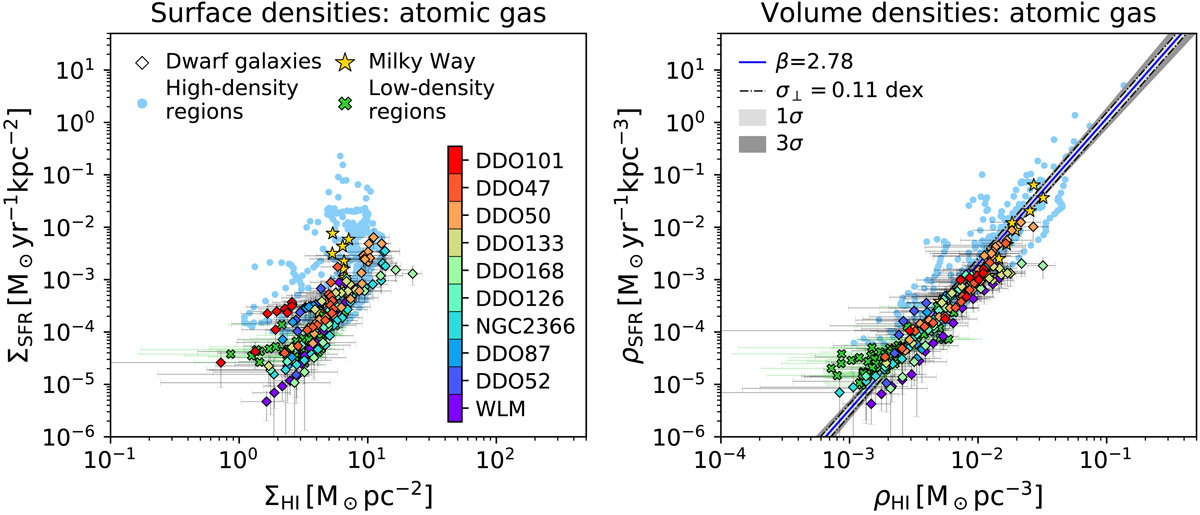
Same as Fig. 3, but here the abscissae of the light blue points are the surface density (left) and the midplane volume density (right) of the atomic gas only, and the SFR scale height is the same as the atomic gas distribution (see text). The blue line shows the best-fit relation (Eq. (16)) obtained in this work.
Current usage metrics show cumulative count of Article Views (full-text article views including HTML views, PDF and ePub downloads, according to the available data) and Abstracts Views on Vision4Press platform.
Data correspond to usage on the plateform after 2015. The current usage metrics is available 48-96 hours after online publication and is updated daily on week days.
Initial download of the metrics may take a while.