Fig. 5
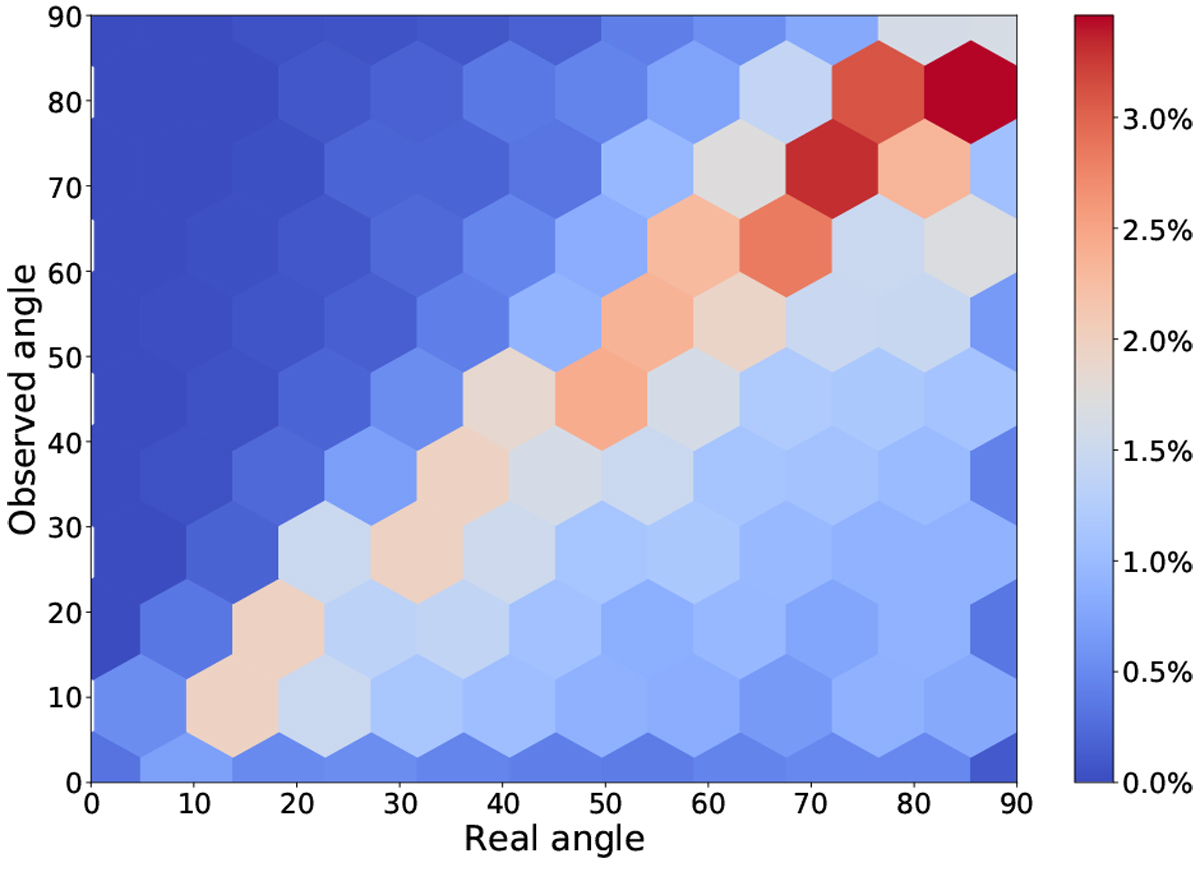
Monte-Carlo test on 10 000 randomly generated vector pairs projected onto a 3D plane mimicking the plane of the sky. This plot shows the density distribution of the angles obtained by projecting these vectors pairs onto the plane compared to their real angle separation in 3D. The color bar indicates the probabilities of each projected versus true angle pair.
Current usage metrics show cumulative count of Article Views (full-text article views including HTML views, PDF and ePub downloads, according to the available data) and Abstracts Views on Vision4Press platform.
Data correspond to usage on the plateform after 2015. The current usage metrics is available 48-96 hours after online publication and is updated daily on week days.
Initial download of the metrics may take a while.