Fig. 4
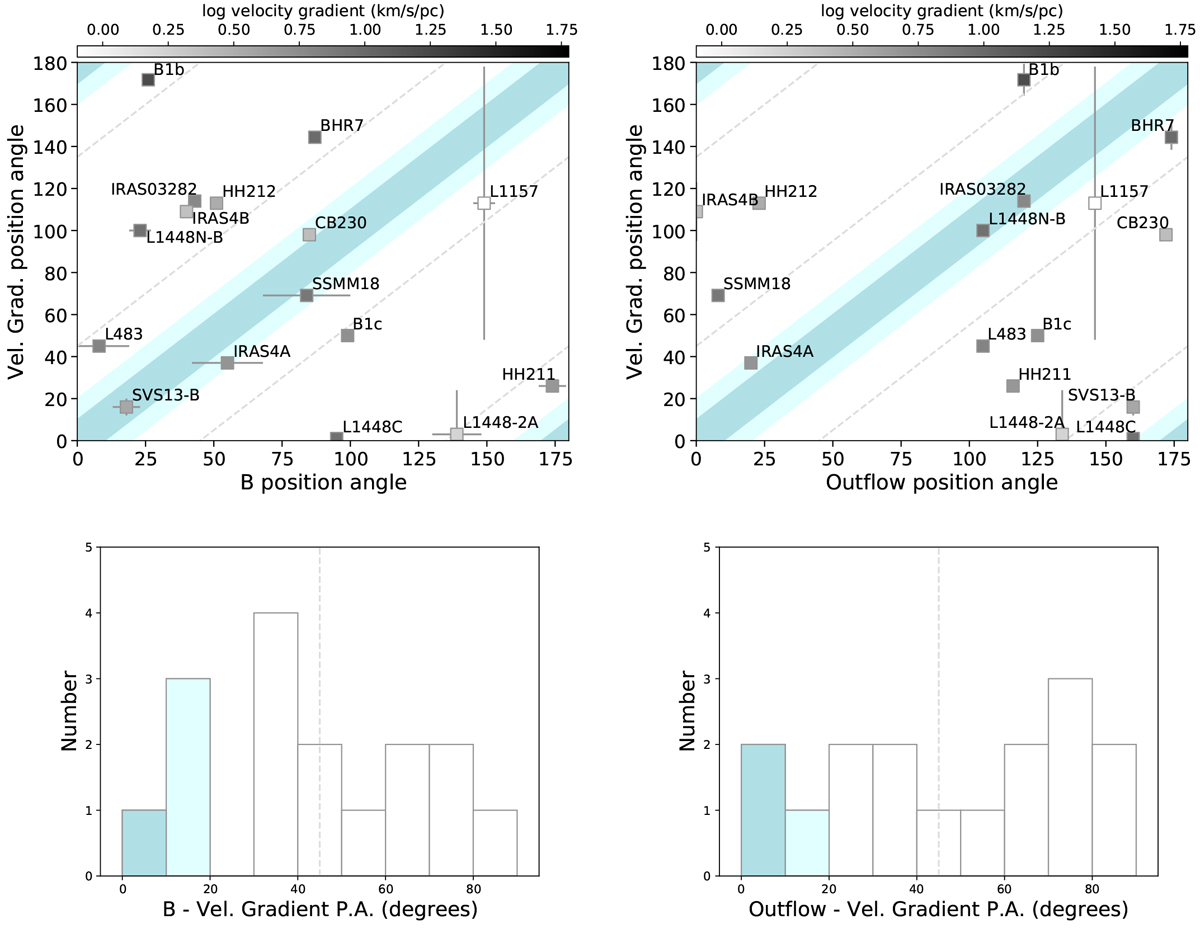
Top left: velocity gradient position angle as a function of the mean magnetic field position angle. The light and darker blue stripes indicate when the projected angle between the two is smaller than 20° and 10° respectively. The dashed line indicates a difference of 45° between the two position angles. Protostars are color-coded as a function of their velocity gradient, with increasing gradients as the color darkens. Top right: relation between the velocity gradient position angle andthe outflow direction. We use the same convention for the stripes and lines. We note that the blue regions indicate sources whose velocity gradient might partly be tracing the outflow motion rather than the envelope motions. Bottom: corresponding histograms of the misalignment of (left) the B field and (right) the outflow axis with respect to the velocity gradient position angle. Colors and lines delineate the same angle offsetsas in the top panels.
Current usage metrics show cumulative count of Article Views (full-text article views including HTML views, PDF and ePub downloads, according to the available data) and Abstracts Views on Vision4Press platform.
Data correspond to usage on the plateform after 2015. The current usage metrics is available 48-96 hours after online publication and is updated daily on week days.
Initial download of the metrics may take a while.