Fig. 3
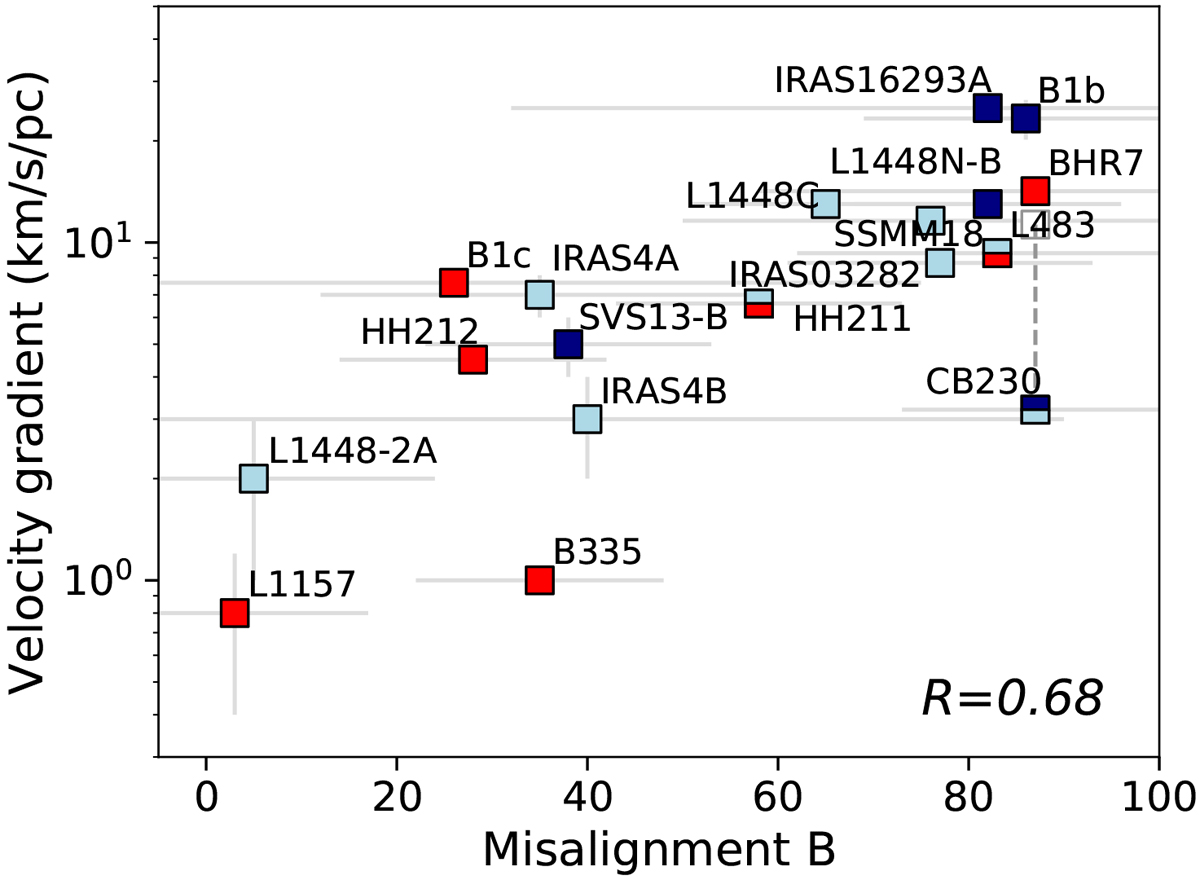
Projected angle between the mean magnetic field within the 1000 au central region and the outflow direction as a function of the velocity gradient of the source estimated from line measurements. Sources are color-coded as a function of their fragmentation below 5000 au scales (with red/light blue/dark blue for sources with a detection of a single/double/3–4 dust peaks). For certain sources, two colors are used: For L483,the ALMA 1.2 mm map from Oya et al. (2017) revealed a continuum source detected at a 5-σ level in the SW region that might suggest fragmentation. For HH211, Lee et al. (2009) detected a companion source with the SMA in the southwestern extension of the source but VLA and ALMA observations have questioned the binary nature of the source (Tobin et al. 2016; Lee et al. 2019). In both cases, the nature of the extra source needs to be better investigated to be confirmed or infirmed as a companion. Finally, CB230-A’s companion seems to host two NIR objects, thus could be part of a triple system (Massi et al. 2008). For this source, we also indicate both the velocity gradient derived by Tobin et al. (2011) from a 1D fit perpendicular to the outflow direction (empty symbol) and a 2D fit of the total velocity field (field symbol), since the two measurements lead to different values of the velocity gradient.
Current usage metrics show cumulative count of Article Views (full-text article views including HTML views, PDF and ePub downloads, according to the available data) and Abstracts Views on Vision4Press platform.
Data correspond to usage on the plateform after 2015. The current usage metrics is available 48-96 hours after online publication and is updated daily on week days.
Initial download of the metrics may take a while.