Fig. 1
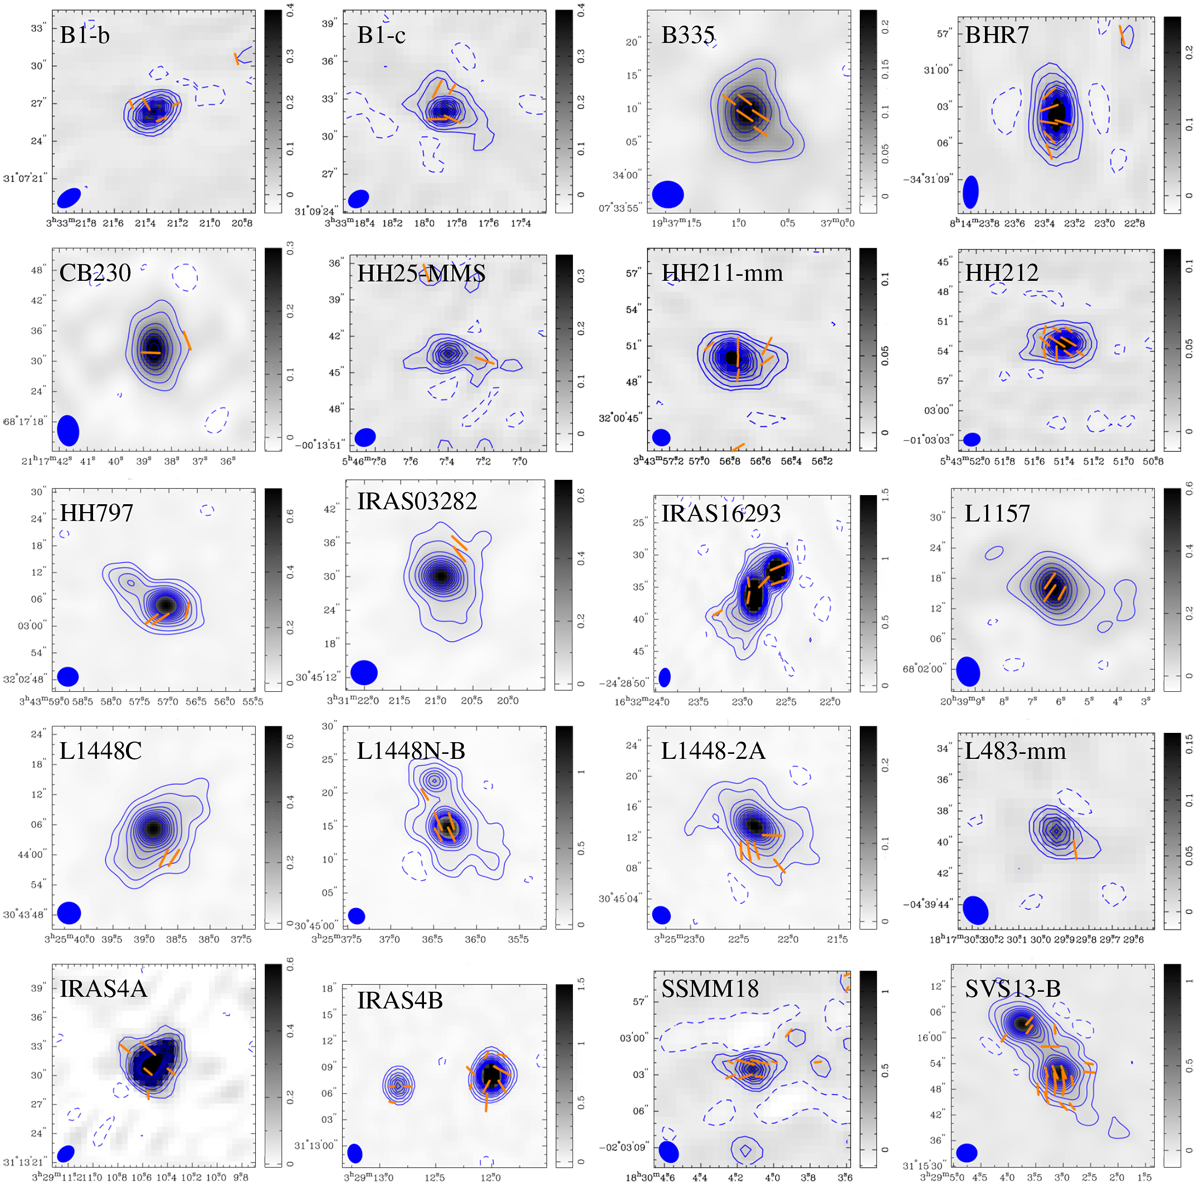
B-field vectors (derived from the polarization vectors assuming a 90° rotation) overlaid as orange segments on the SMA 850 μm Stokes I continuum maps. Color scales are in Jy beam−1. Contours at [−3,5,10,20,30,40,50,60,70,80,90,100] σ appear in blue. The filled ellipses on the lower left corner indicate the synthesized beam of the SMA maps.
Current usage metrics show cumulative count of Article Views (full-text article views including HTML views, PDF and ePub downloads, according to the available data) and Abstracts Views on Vision4Press platform.
Data correspond to usage on the plateform after 2015. The current usage metrics is available 48-96 hours after online publication and is updated daily on week days.
Initial download of the metrics may take a while.