Fig. 5
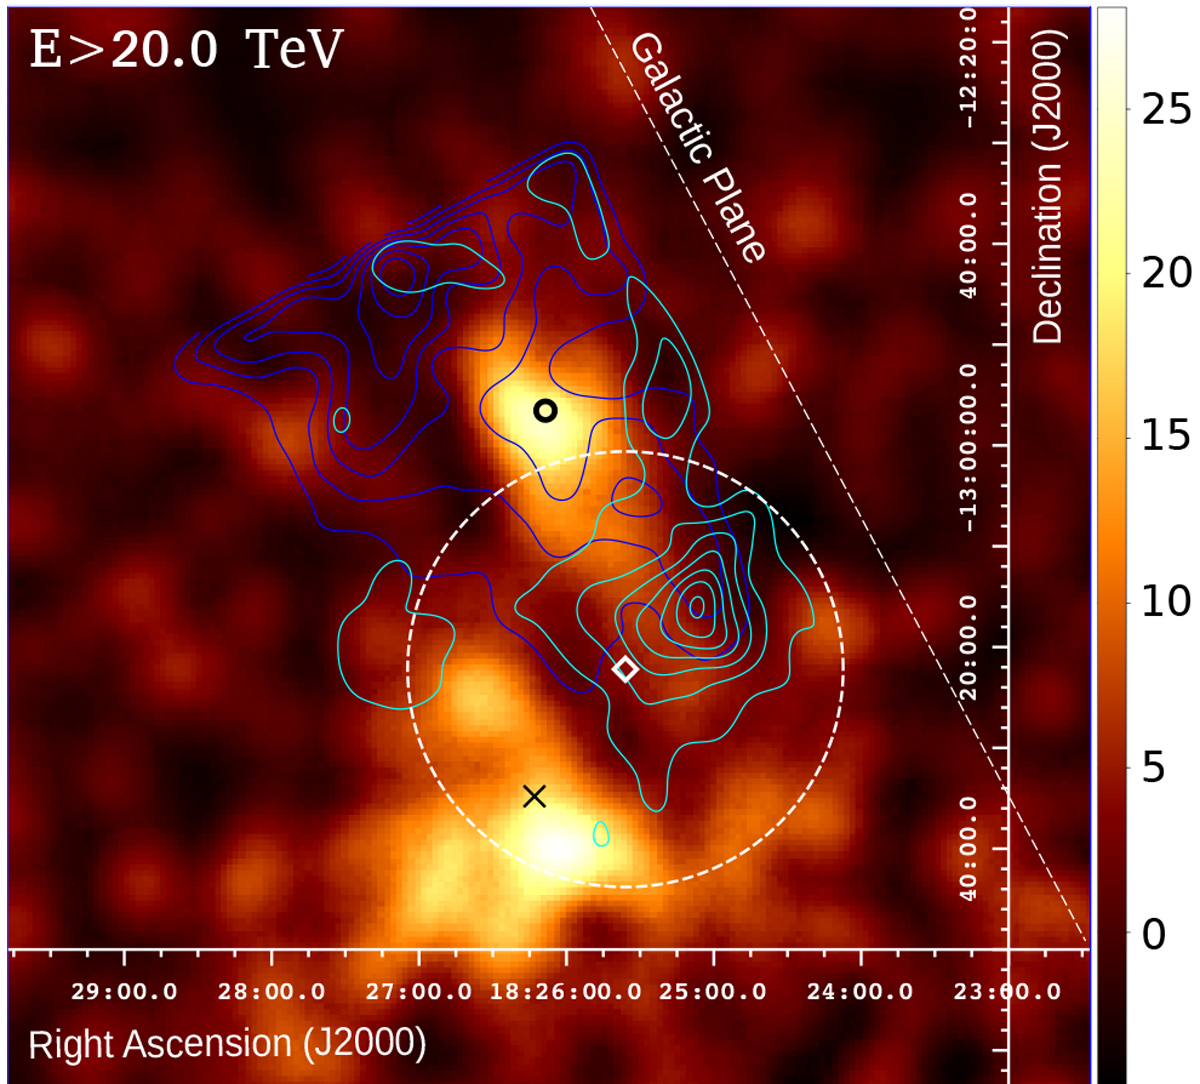
VHE γ-ray excess map of HESS J1826−130 for events above 20 TeV, together with total column density map contours. The black circle and cross show the location of the pulsars PSR J1826−1256 and PSR J1826−1334. The cyan and blue contours show the total column density contours of [2.5, 9.5] × 1022 cm2, derived fromNobeyama 12CO(1–0) and SGPS HI data, for gas velocities between 45–60 km s−1 (d: 4 kpc) and 60–80 km s−1 (d: 4.6 kpc), respectively. The white dashed circle and diamond are the extension and best-fit position of recently reported E > 100 TeV emitting source, eHWC J1825−134 (HAWC Collaboration 2020).
Current usage metrics show cumulative count of Article Views (full-text article views including HTML views, PDF and ePub downloads, according to the available data) and Abstracts Views on Vision4Press platform.
Data correspond to usage on the plateform after 2015. The current usage metrics is available 48-96 hours after online publication and is updated daily on week days.
Initial download of the metrics may take a while.