Fig. 4
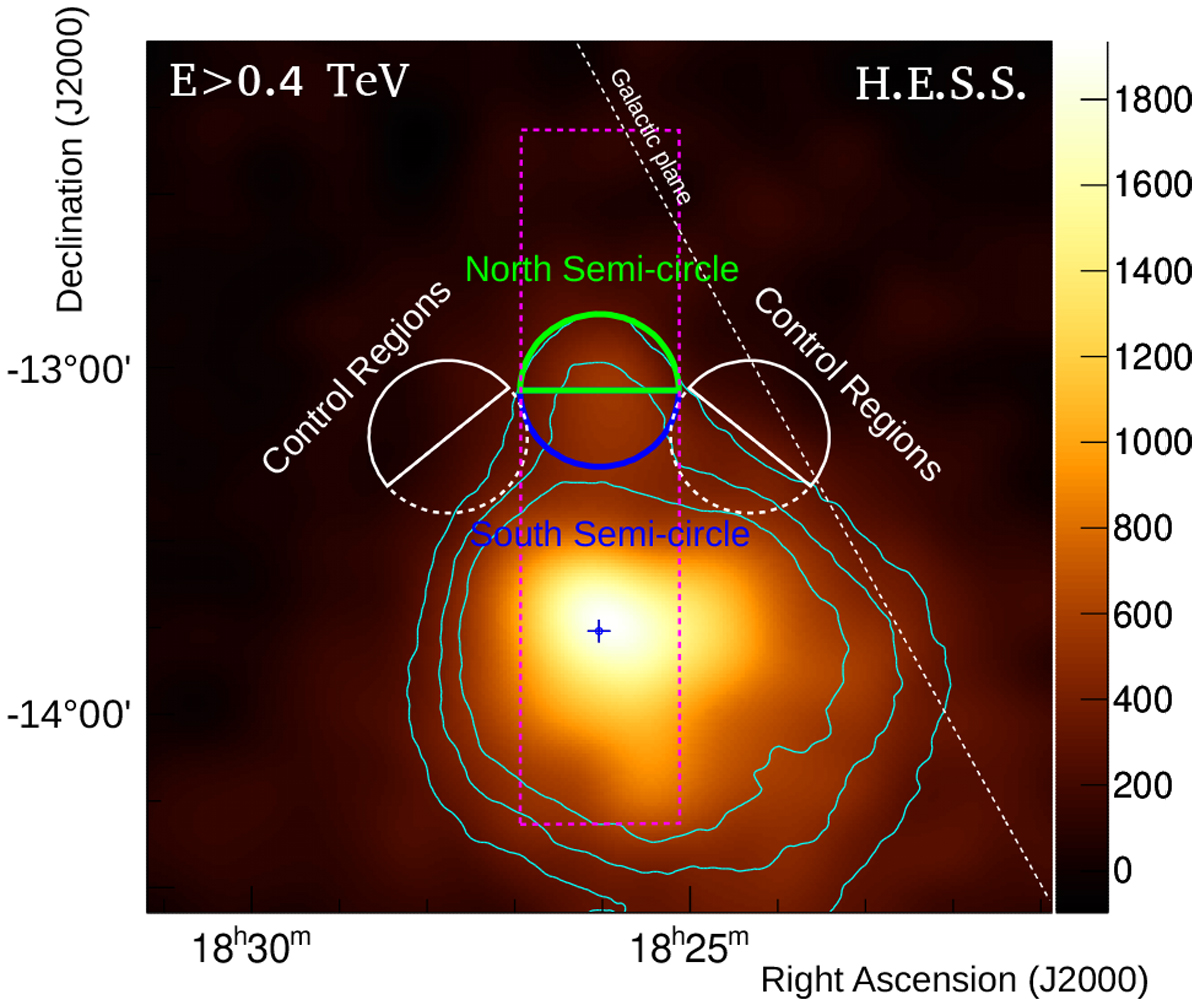
VHE γ-ray excess map of HESS J1826−130 for all events saturated for a better visualization, showing the north semi-circle (green), south semi-circle (blue), and control regions for both north (solid white) and south (dashed white) semi-circle regions. The control regions are distributed in a radially symmetric manner around the peak position of HESS J1825−137, indicated with the blue cross, obtained from the dataset and for energies above 0.4 TeV. The cyan contours indicate the significance of the emission at the 15σ, 20σ and 25σ levels.
Current usage metrics show cumulative count of Article Views (full-text article views including HTML views, PDF and ePub downloads, according to the available data) and Abstracts Views on Vision4Press platform.
Data correspond to usage on the plateform after 2015. The current usage metrics is available 48-96 hours after online publication and is updated daily on week days.
Initial download of the metrics may take a while.