Fig. 3
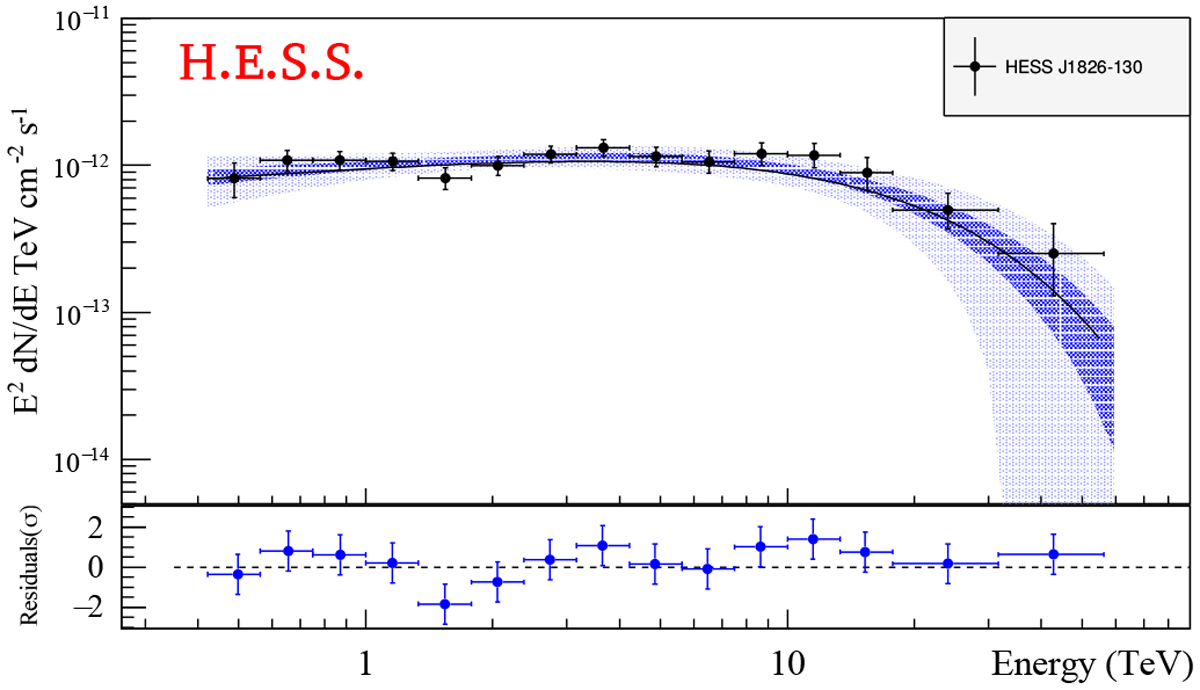
VHE γ-ray spectrum of HESS J1826−130 extracted from the green circular source region shown in Fig. 1. The black dots show the flux points with 1σ statistical errors. The 1σ and 3σ error bands of the best-fit ECPL model are shown with the blue and light blue shaded regions, respectively, while the best-fit ECPL model itself is shown with the black line. The spectrum shown is binned such that all flux points have a minimum significance level of 2.0σ. The significance of the last flux bin centered at 42.7 TeV is 2.4σ.
Current usage metrics show cumulative count of Article Views (full-text article views including HTML views, PDF and ePub downloads, according to the available data) and Abstracts Views on Vision4Press platform.
Data correspond to usage on the plateform after 2015. The current usage metrics is available 48-96 hours after online publication and is updated daily on week days.
Initial download of the metrics may take a while.