Fig. 1
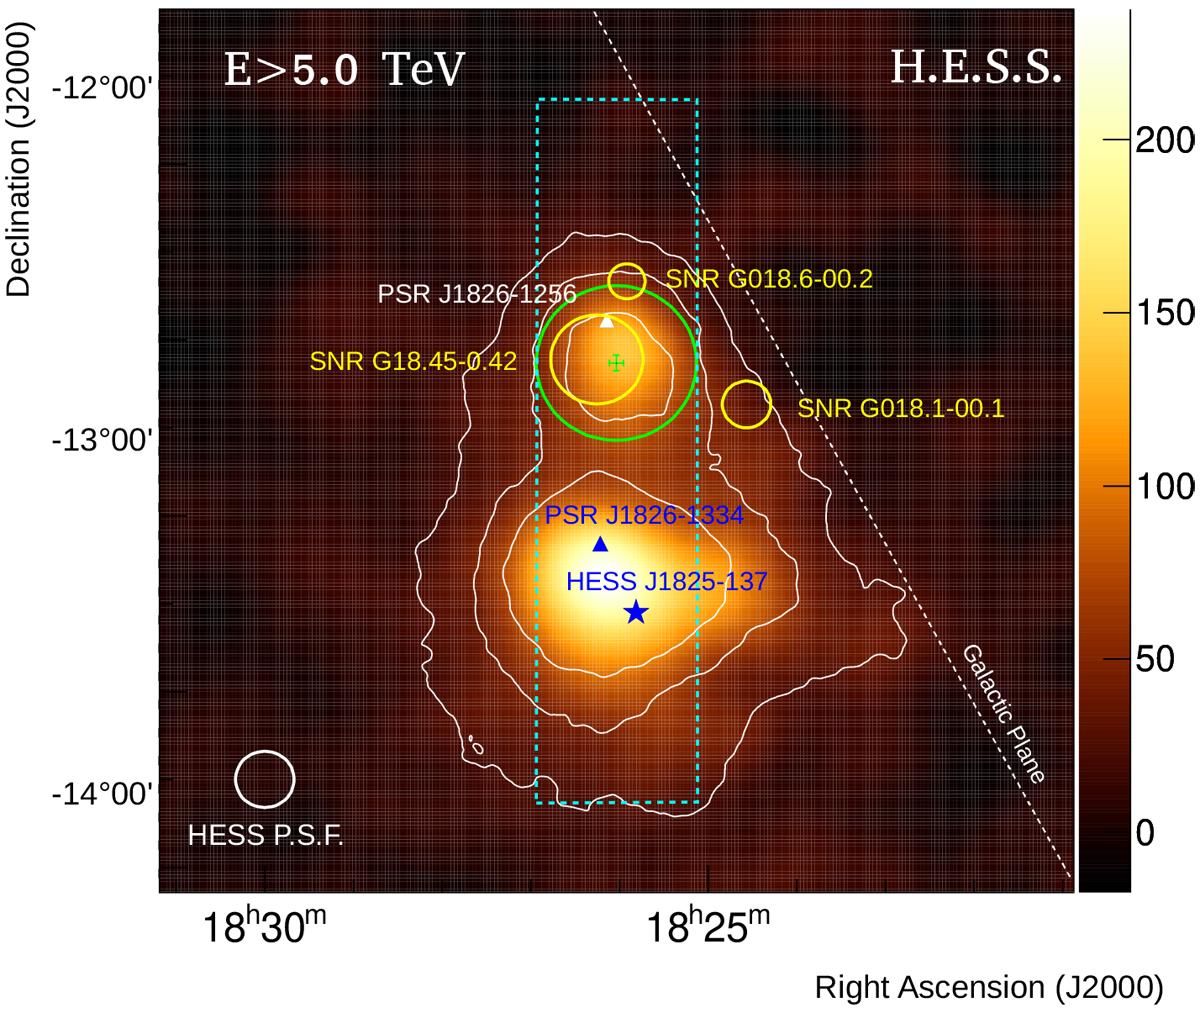
Map of excess counts with energies E > 5 TeV for region around HESS J1826−130 smoothed with a Gaussian kernel of 0.07° to match HESS PSF at the same energies. The 68% containment radius of the HESS PSF is shown with the white circle in the lower-leftcorner. The white contours indicate the significance of the emission at the 5σ, 10σ, and 15σ level. The color scale is in units of excess counts per smoothing Gaussian width. The green circle shows the integration region used for deriving the source spectrum (Fig. 3), while the green cross indicates the value and 1σ uncertainty of the best-fit position of the source. The nearby SNRs: G18.45−0.42, G018.6−00.2, and G018.1−00.1 are represented with yellow circles, while the white triangle indicates the position of the γ-ray pulsar PSR J1826−1256. The blue star shows the peak position of the bright nearby source HESS J1825−137 for energies above 0.25 TeV (we employed the position as reported in H.E.S.S. Collaboration 2019 since the data set analyzed here accounts for a total exposure across all of HESS J1825−137, which is less than that used in its dedicated study). The blue triangle indicates the position of PSR J1826−1334. The white dashed line indicates the orientation and position of the Galactic plane, while the cyan dashed rectangle indicates the area for the extraction of the profiles shown in Fig. 2.
Current usage metrics show cumulative count of Article Views (full-text article views including HTML views, PDF and ePub downloads, according to the available data) and Abstracts Views on Vision4Press platform.
Data correspond to usage on the plateform after 2015. The current usage metrics is available 48-96 hours after online publication and is updated daily on week days.
Initial download of the metrics may take a while.