Fig. 15.
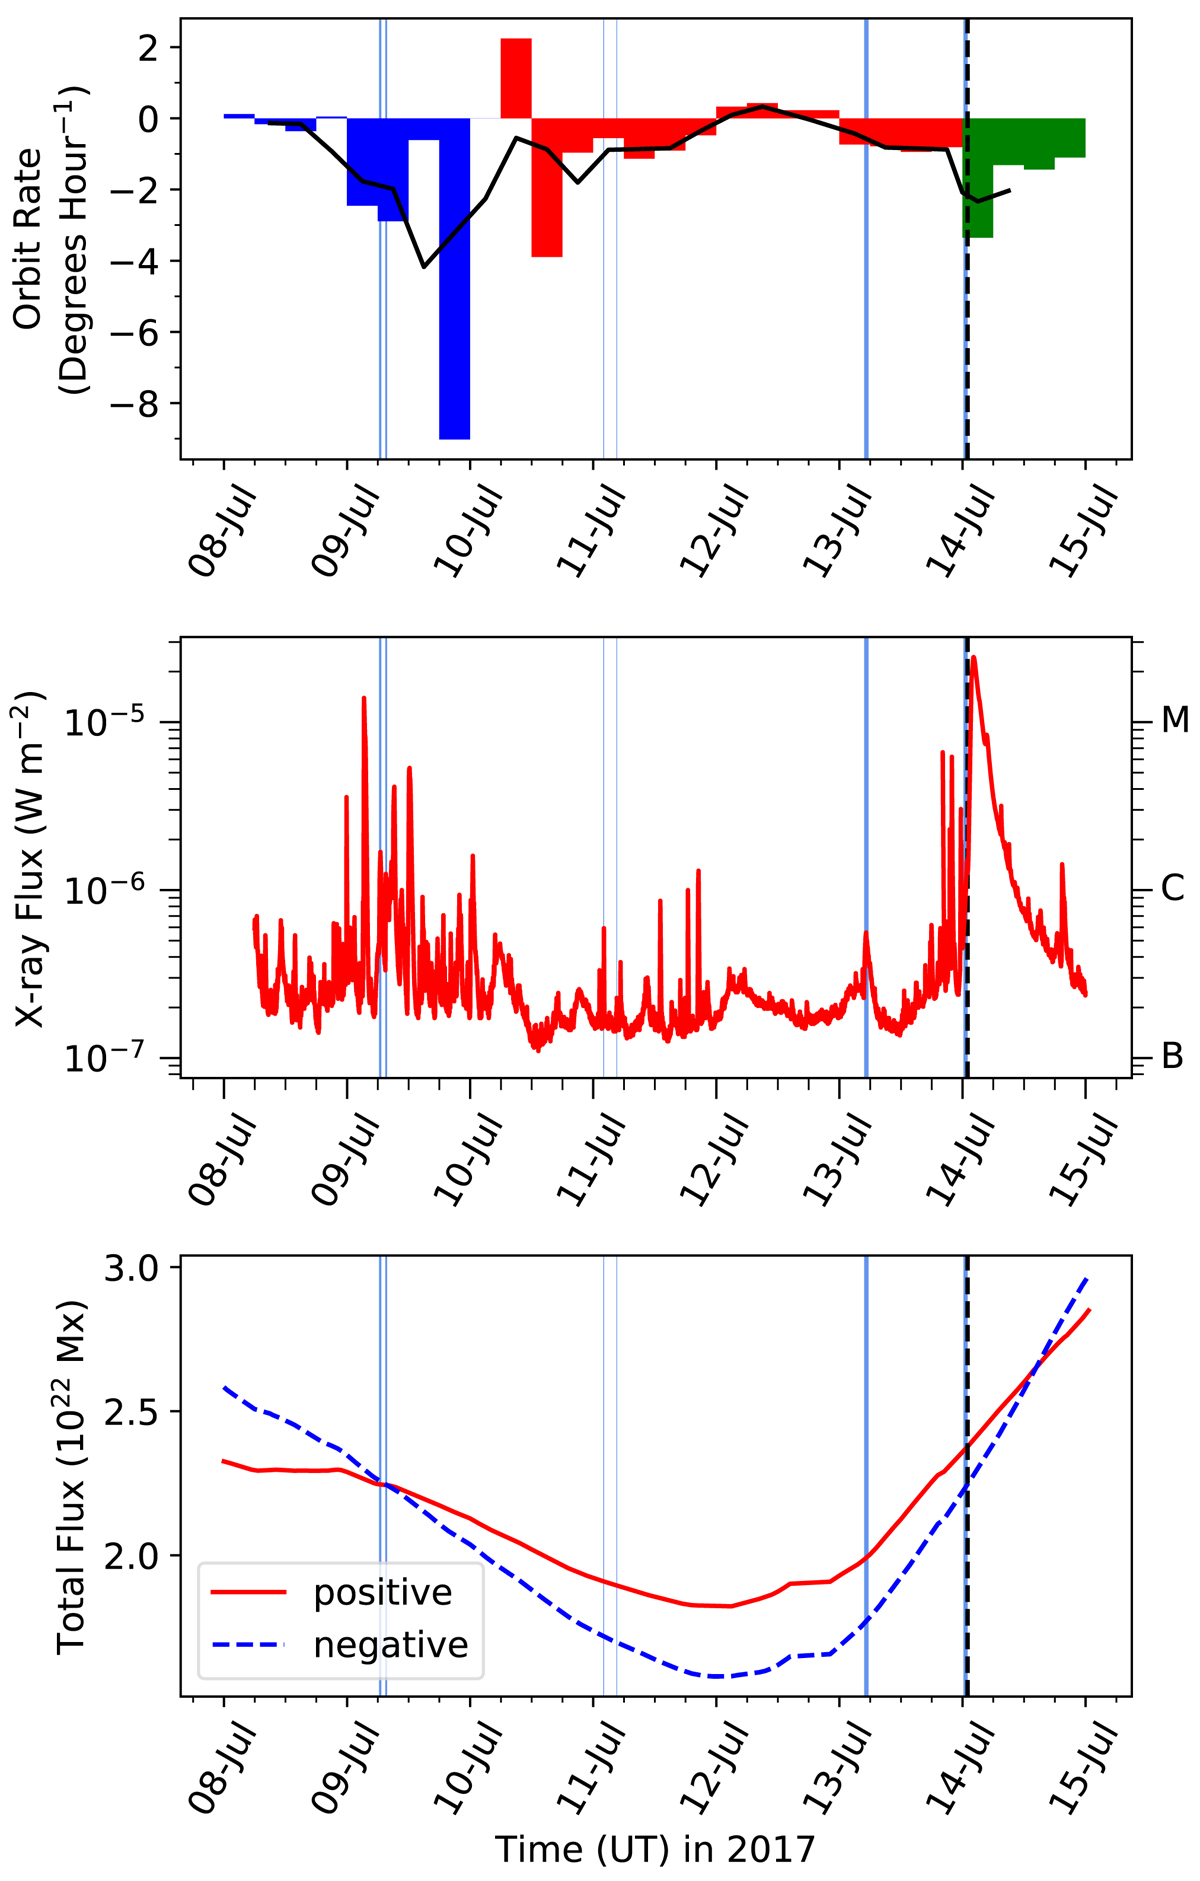
Top: measured orbital motion of chosen magnetic flux fragments in 6-hour intervals. The colours correspond to different choices of fragments (see Fig. 14). The black curve represents the orbit angles smoothed with a three-point moving average. Middle: full-disc integrated GOES soft X-ray lightcurve. Bottom: the evolution of magnetic flux in NOAA AR 12665, made using the radial magnetic field component, Br, of the HMI SHARP data series and smoothed with a 24-hour moving average. The vertical dashed line indicates the time of CME onset on 14 July 2017, and the thin, light-blue vertical bars show the timings of confined flares associated with flux rope formation described in Sect. 4.4.1.
Current usage metrics show cumulative count of Article Views (full-text article views including HTML views, PDF and ePub downloads, according to the available data) and Abstracts Views on Vision4Press platform.
Data correspond to usage on the plateform after 2015. The current usage metrics is available 48-96 hours after online publication and is updated daily on week days.
Initial download of the metrics may take a while.