Fig. 13.
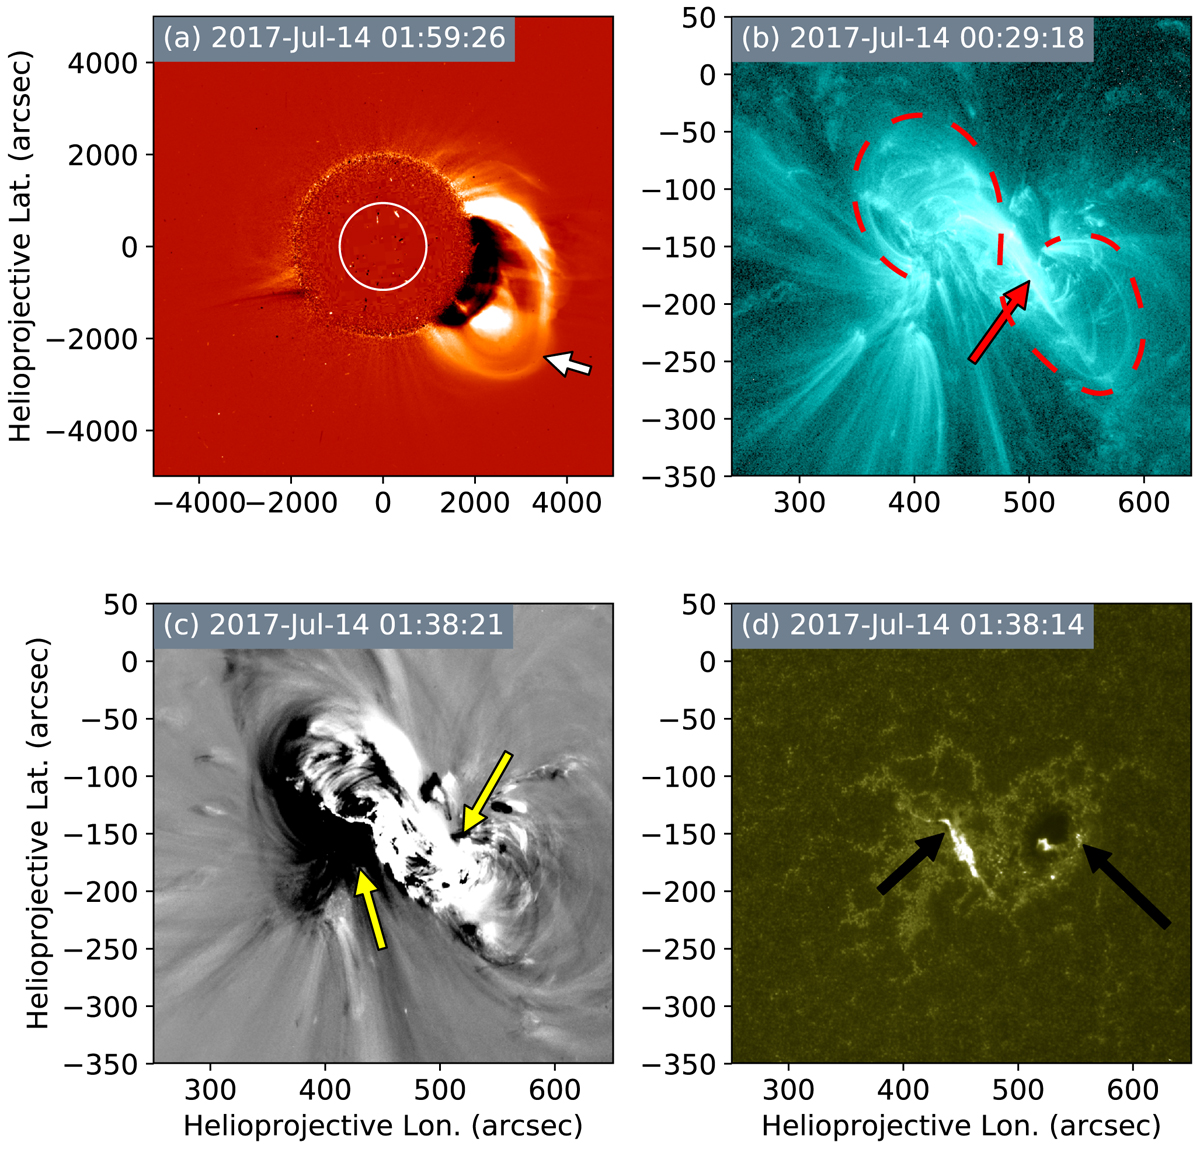
Observations of the 14 July 2017 eruption. (a) White-light CME (indicated by the white arrow) observed by LASCO C2. (b) Curved loops (indicated by the dashed red lines) that may belong to a sigmoid above the observed flare arcade (indicated by the red arrow) in the 131 Å channel of AIA. (c) Twin EUV dimmings (marked by the two yellow arrows) seen in base difference 211 Å images. (d) Flare ribbons (indicated by two black arrows) seen in the 1600 Å channel of AIA.
Current usage metrics show cumulative count of Article Views (full-text article views including HTML views, PDF and ePub downloads, according to the available data) and Abstracts Views on Vision4Press platform.
Data correspond to usage on the plateform after 2015. The current usage metrics is available 48-96 hours after online publication and is updated daily on week days.
Initial download of the metrics may take a while.