Fig. 7.
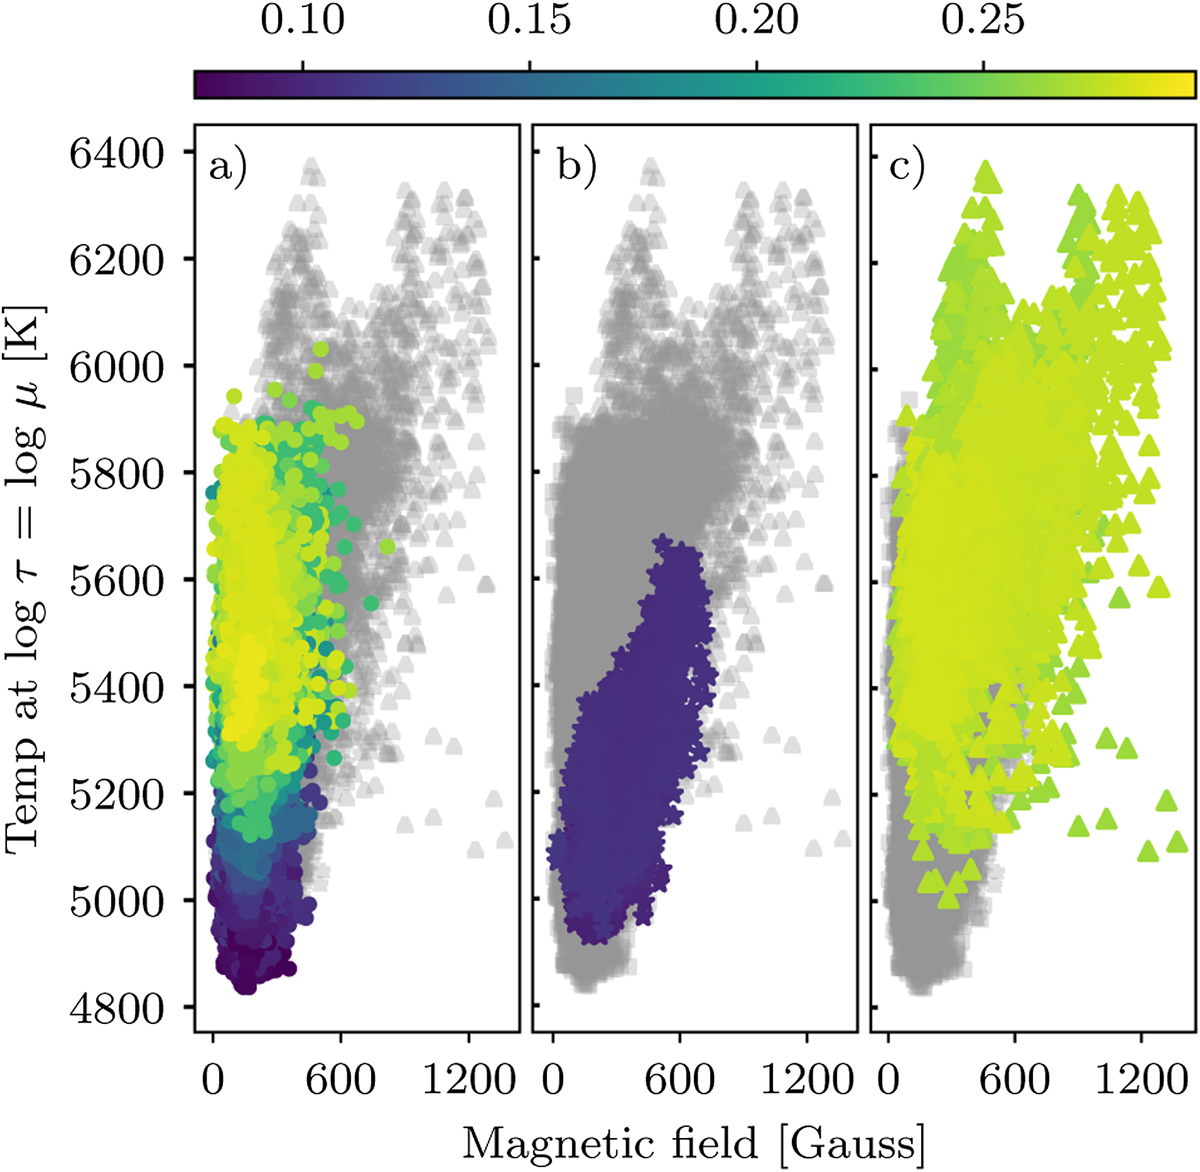
Scatter plot of magnetic field strength versus temperature. All three panels show the same pixels but the different populations (see text) are highlighted by colour coding with μ. The data points in the figure are pixels in the FOV which meet the noise thresholds. Pixels from large magnetic patches with embedded polar faculae (panels b and c) are denoted with asterisks and solid triangles. The plot has data points from two consecutive observing runs of IMaX.
Current usage metrics show cumulative count of Article Views (full-text article views including HTML views, PDF and ePub downloads, according to the available data) and Abstracts Views on Vision4Press platform.
Data correspond to usage on the plateform after 2015. The current usage metrics is available 48-96 hours after online publication and is updated daily on week days.
Initial download of the metrics may take a while.