Open Access
Fig. 6.
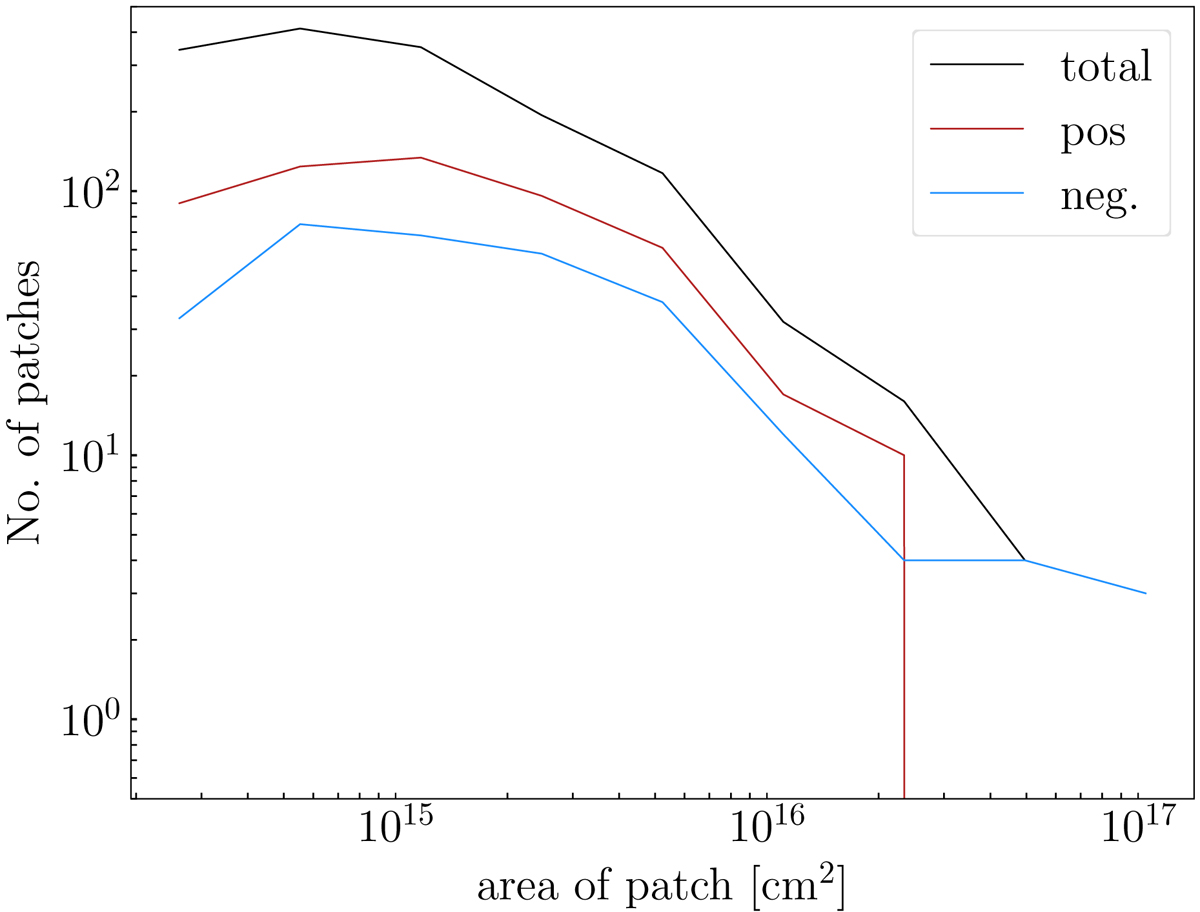
Histogram of the area of the magnetic patches in the FOV (black curve) as a function of patch area. The blue (red) curve is for patches with a negative (positive) polarity. The dominant polarity of the north polar region in 2009 was negative.
Current usage metrics show cumulative count of Article Views (full-text article views including HTML views, PDF and ePub downloads, according to the available data) and Abstracts Views on Vision4Press platform.
Data correspond to usage on the plateform after 2015. The current usage metrics is available 48-96 hours after online publication and is updated daily on week days.
Initial download of the metrics may take a while.