Fig. 5.
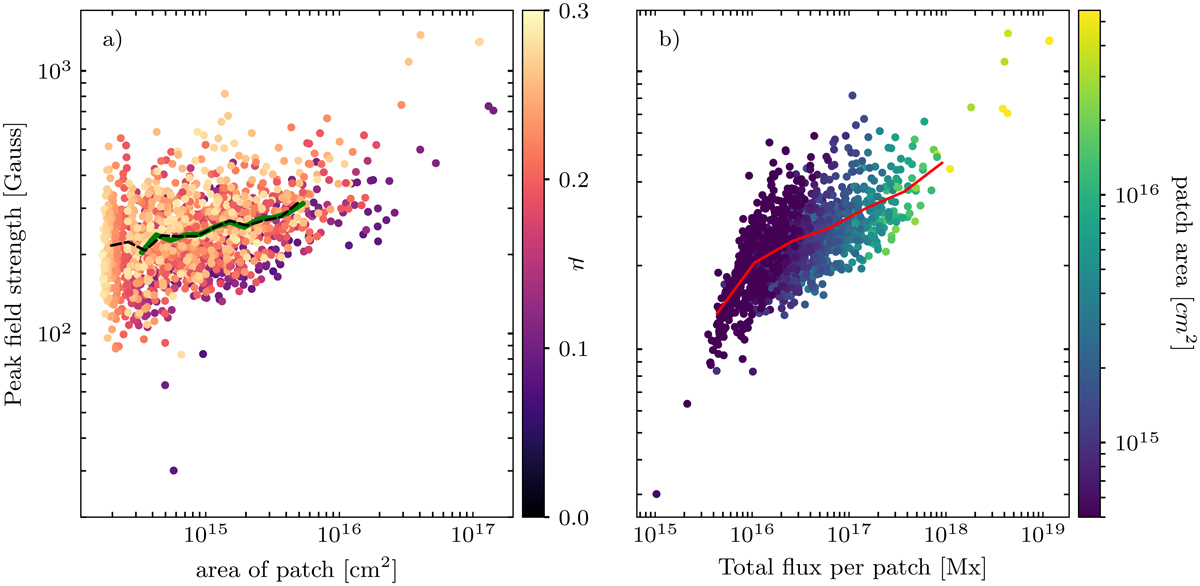
Peak magnetic field within a patch versus area of the patch (panel a) and versus total flux per patch (panel b). Each data point represents a magnetic patch, with the colour in panel a showing its μ value and in panel b its area, corrected for the heliocentric position of the patch. In panel a, the green curve shows the average value of the data points in logarithmic spaced bins for patches with μ ≤ 0.17 and the dotted black curve is for patches with μ ≥ 0.17. The red curve in panel b shows the average value of all data points in logarithmically spaced bins. The plot contains all patches from two consecutive observing runs of the full Stokes vector recorded by IMaX, which meet the PSC described in Sect. 2.
Current usage metrics show cumulative count of Article Views (full-text article views including HTML views, PDF and ePub downloads, according to the available data) and Abstracts Views on Vision4Press platform.
Data correspond to usage on the plateform after 2015. The current usage metrics is available 48-96 hours after online publication and is updated daily on week days.
Initial download of the metrics may take a while.