Fig. 3.
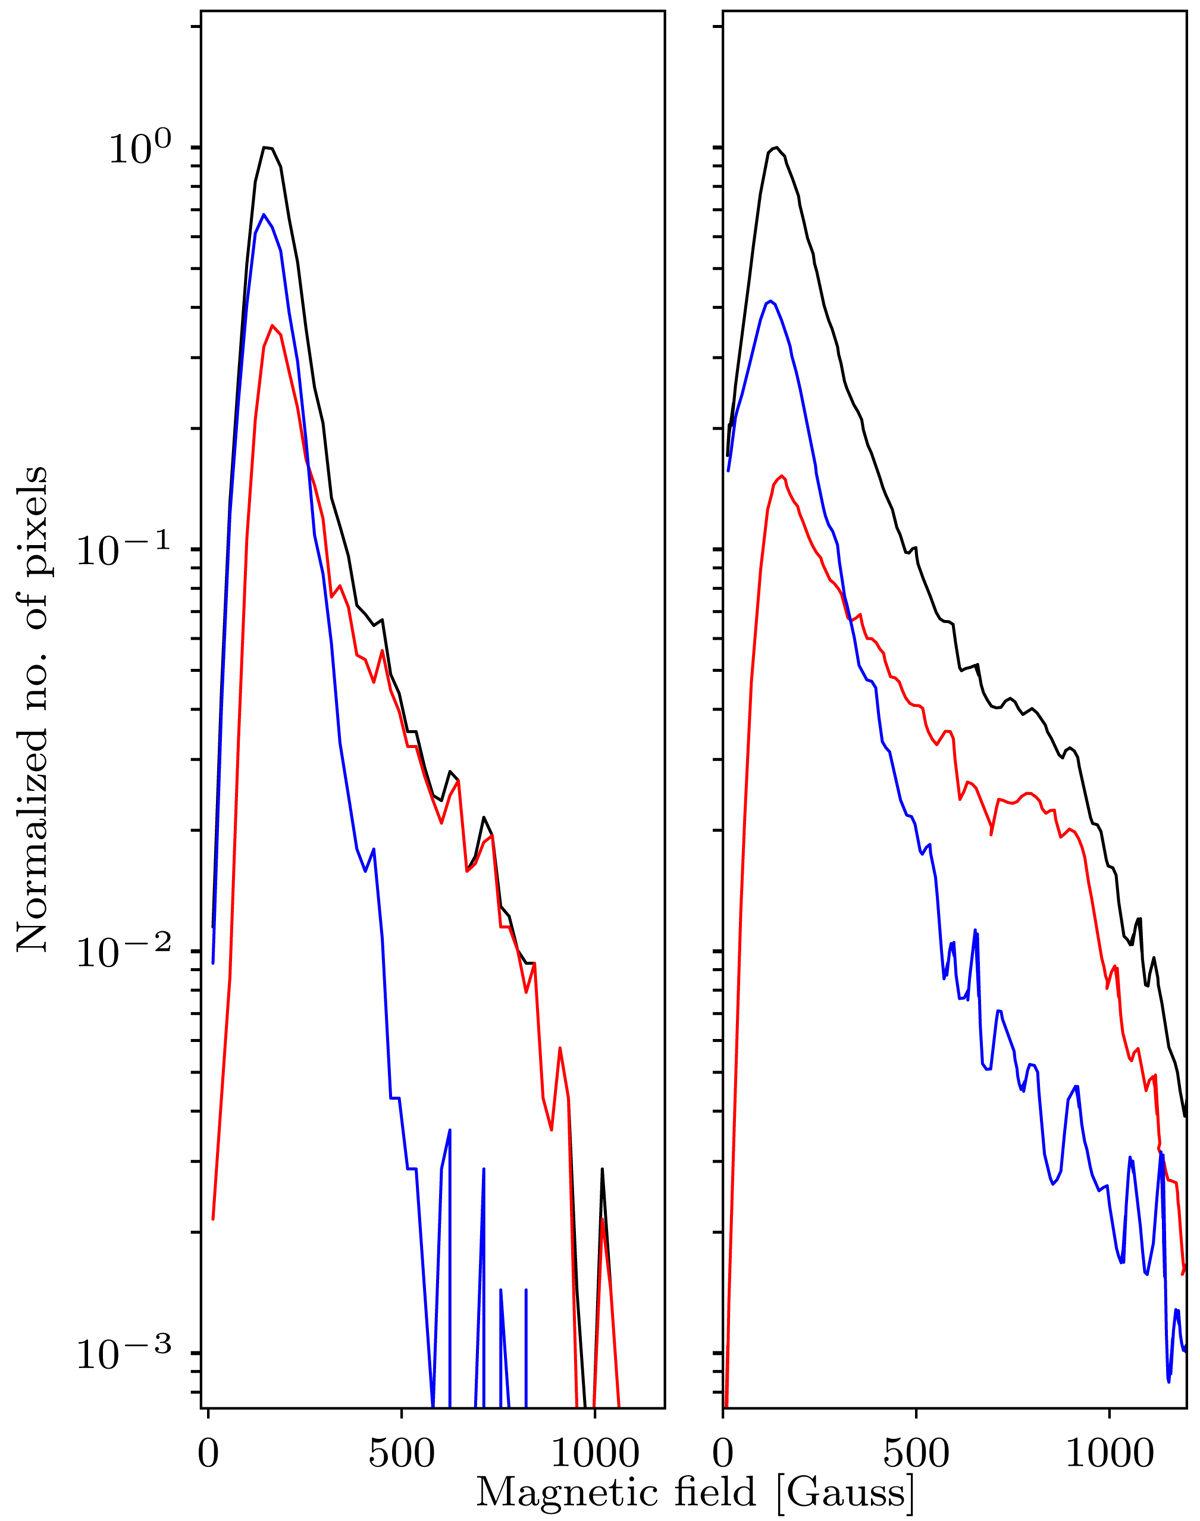
Histogram of magnetic field strength, retrieved from a single component inversion of PD restored data (left) only for the pixels meeting the noise and size thresholds described in Sect. 2. A similar histogram, digitised from Tsuneta et al. (2008b), is shown on the right for comparison. The black lines show the distributions for all pixels, the red lines represent pixels with fields vertical to the local surface and the blue lines indicate pixels with fields horizontal to the surface. In both cases the number of pixels is normalised to the maximum number of pixels in the black line.
Current usage metrics show cumulative count of Article Views (full-text article views including HTML views, PDF and ePub downloads, according to the available data) and Abstracts Views on Vision4Press platform.
Data correspond to usage on the plateform after 2015. The current usage metrics is available 48-96 hours after online publication and is updated daily on week days.
Initial download of the metrics may take a while.