Free Access
Fig. 9.
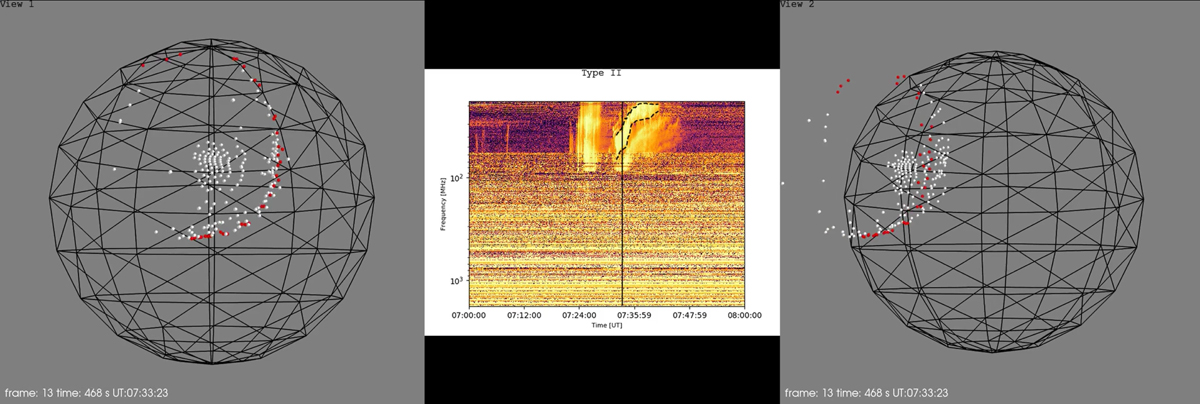
Left and right: same as Fig. 5 for Event 2. Middle: dynamic radio spectrum from the Culgoora station showing the type II radio burst signature and the selected boundaries. The vertical line represents the position in time in all the panels (07:33:23 UT).
Current usage metrics show cumulative count of Article Views (full-text article views including HTML views, PDF and ePub downloads, according to the available data) and Abstracts Views on Vision4Press platform.
Data correspond to usage on the plateform after 2015. The current usage metrics is available 48-96 hours after online publication and is updated daily on week days.
Initial download of the metrics may take a while.