Fig. 5.
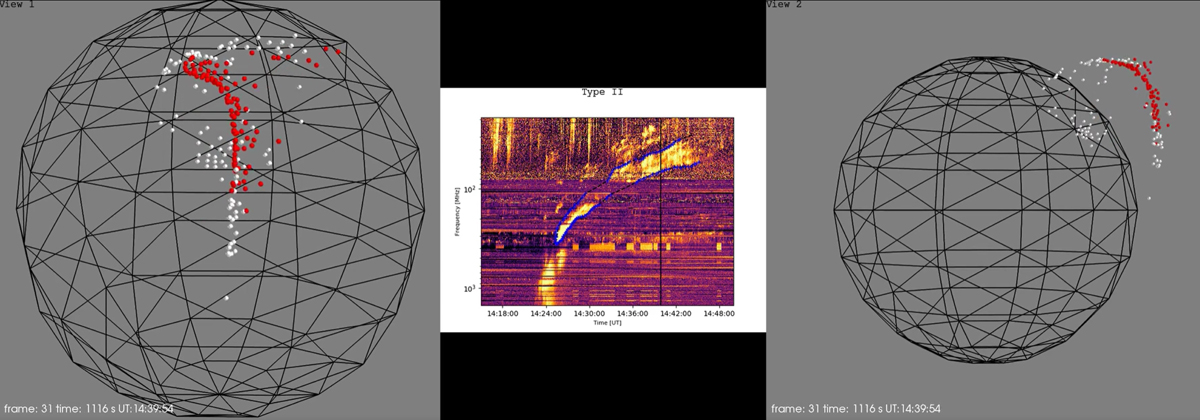
Left and right: simulated wave front with white and red points on top of a spherical mesh representing the solar surface, in two viewing positions for Event 1. The red points are identified as the potential source of the type II radio burst emission. Both panels represent the same moment in the simulation, which is shown in white in the bottom-left corner together with the UT time and the frame number of the movie (Event 1 movie 2). Middle: dynamic radio spectrum from the Humain and Nançay stations showing the type II radio burst signature and the selected boundaries. The vertical line represents the position in time in all the panels (14:39:54 UT).
Current usage metrics show cumulative count of Article Views (full-text article views including HTML views, PDF and ePub downloads, according to the available data) and Abstracts Views on Vision4Press platform.
Data correspond to usage on the plateform after 2015. The current usage metrics is available 48-96 hours after online publication and is updated daily on week days.
Initial download of the metrics may take a while.