Fig. 4.
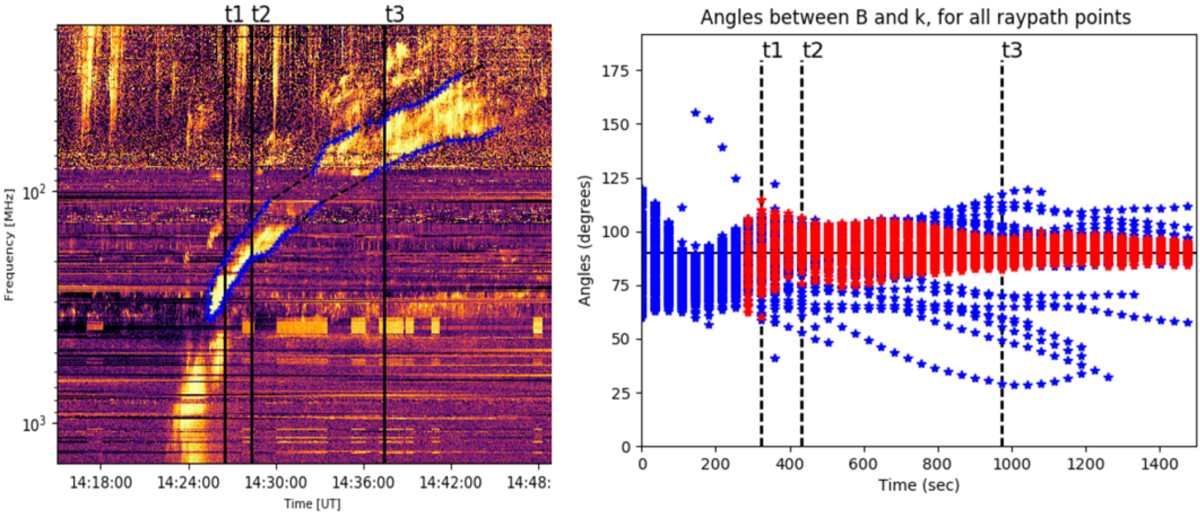
Left: dynamic radio spectrum from the Humain station, showing the signature of the type II radio burst during Event 1. The three vertical lines correspond to the time of the snapshots in Fig. 3. Blue crosses represent manually selected points and the dashed black lines the fitting curves. Right: angles between the magnetic field and the wave vector for every ray-path point. Red indicates the ray-path points that are identified as the potential source of the type II radio burst emission based on the local electron density matching the plasma frequency.
Current usage metrics show cumulative count of Article Views (full-text article views including HTML views, PDF and ePub downloads, according to the available data) and Abstracts Views on Vision4Press platform.
Data correspond to usage on the plateform after 2015. The current usage metrics is available 48-96 hours after online publication and is updated daily on week days.
Initial download of the metrics may take a while.