Fig. 3.
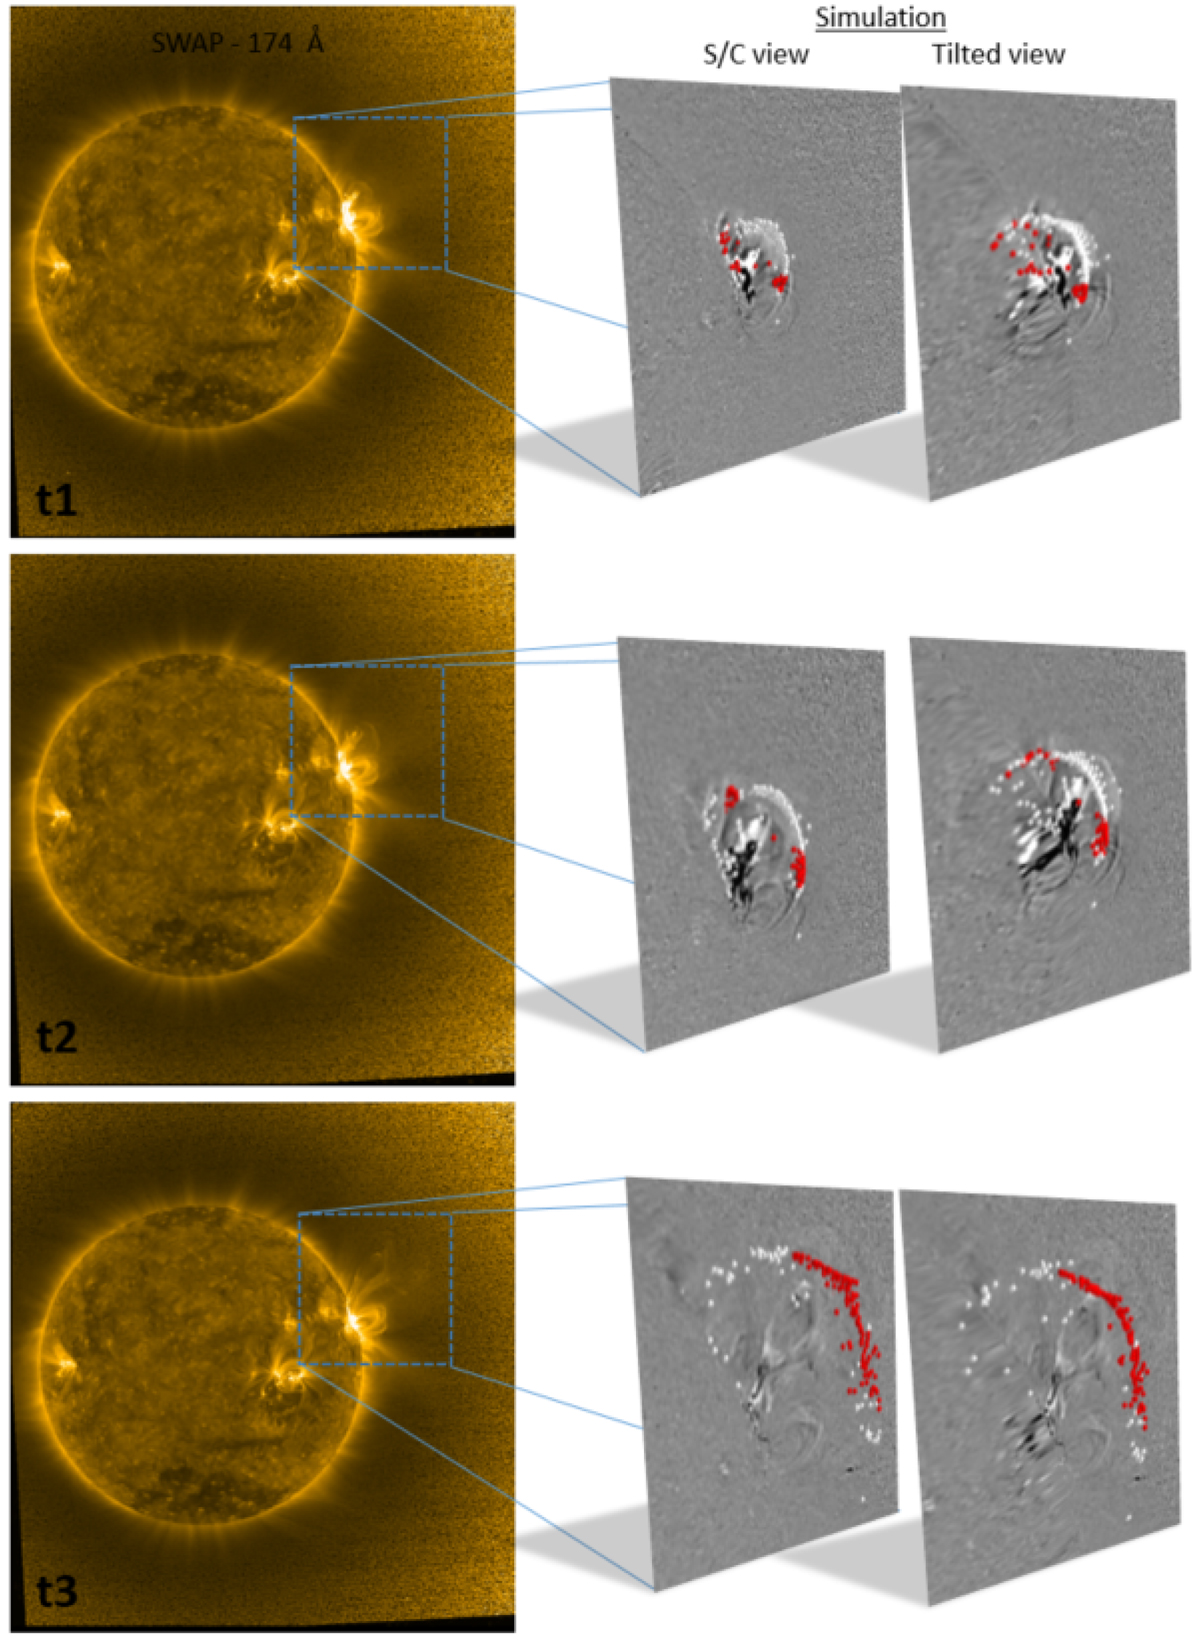
Left: images of PROBA2/SWAP 174 Å for three different times during Event 1 (from top to bottom: 14:26:10 UT, 14:28:00 UT, 14:37:10 UT). Right insets: zoom into the region of interest. The simulated wave front is displayed with white and red points on top of a background of PROBA2/SWAP running-difference images. Two different viewing angles for the same moment are shown, one that represents the PROBA2 viewing position and one tilted viewing position (19° in azimuth) that was selected to optimize the visibility of the simulated wave front. The red points are identified candidates for the type II radio burst emission (see Sect. 2.4).
Current usage metrics show cumulative count of Article Views (full-text article views including HTML views, PDF and ePub downloads, according to the available data) and Abstracts Views on Vision4Press platform.
Data correspond to usage on the plateform after 2015. The current usage metrics is available 48-96 hours after online publication and is updated daily on week days.
Initial download of the metrics may take a while.