Fig. D.1.
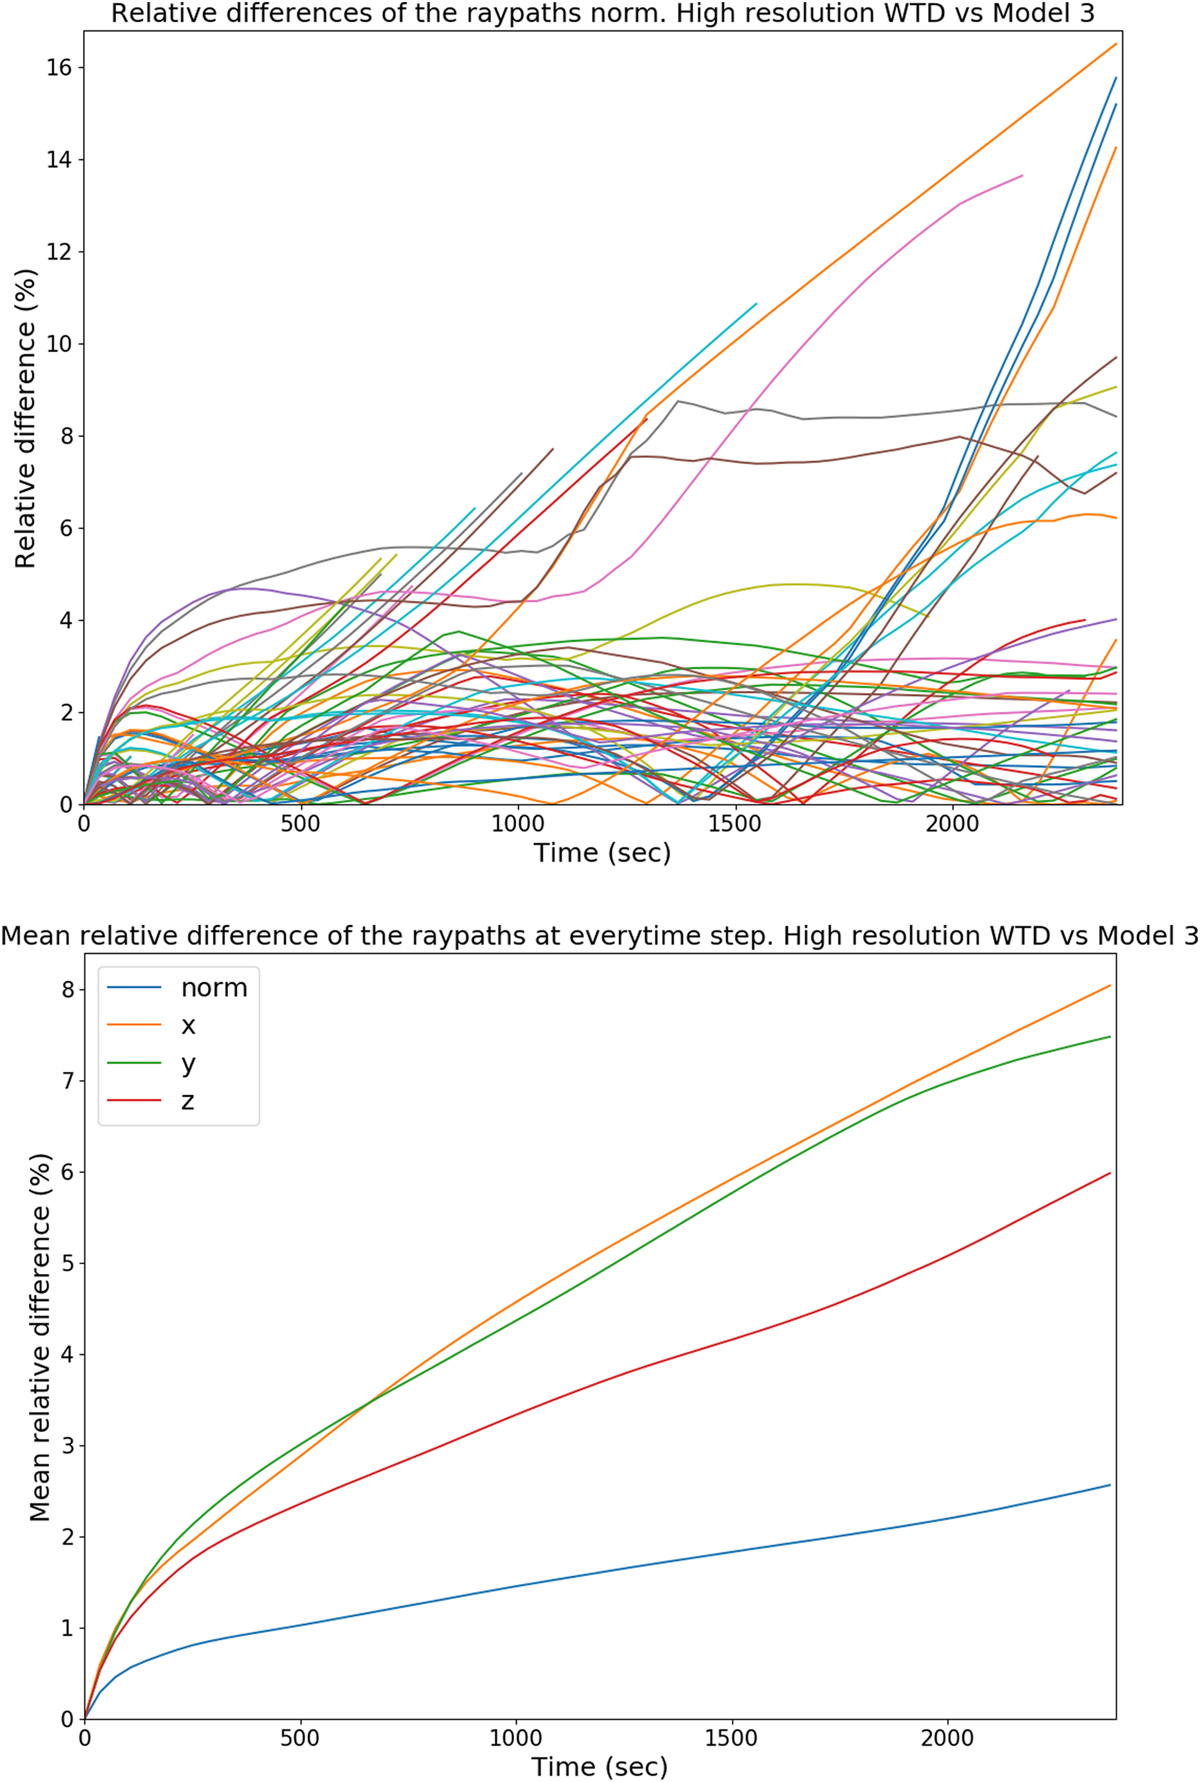
Top: percentage of the relative difference between the norm of the position for every ray path. The different colors represent different ray paths. The comparison is made between the high-resolution WTD model and Model 3. Bottom: percentage of the mean relative difference amongst the ray paths of the high-resolution WTD model and Model 3. This metric is shown for the three spatial components and the norm, with the colors given in the legend.
Current usage metrics show cumulative count of Article Views (full-text article views including HTML views, PDF and ePub downloads, according to the available data) and Abstracts Views on Vision4Press platform.
Data correspond to usage on the plateform after 2015. The current usage metrics is available 48-96 hours after online publication and is updated daily on week days.
Initial download of the metrics may take a while.