Free Access
Fig. 9.
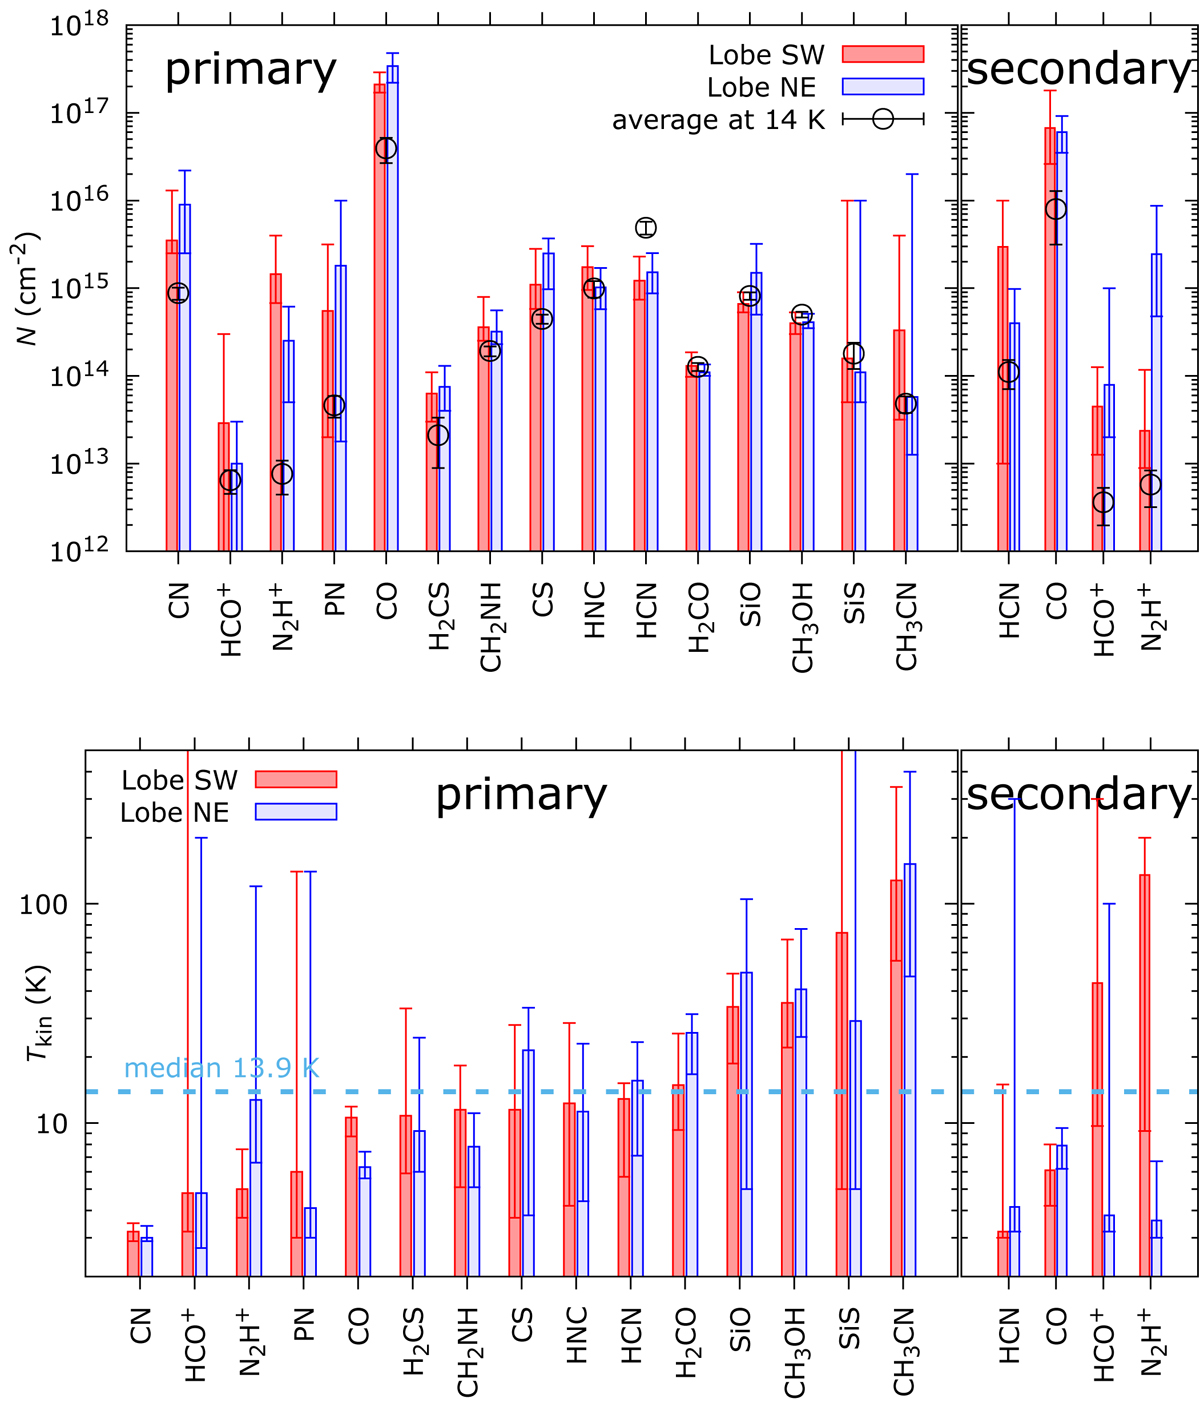
Similar to Fig. 7 but column densities (top) and temperatures (bottom) are shown for the SW and NE regions within the lobes. The primary (neutral) and secondary (ionized) components are defined in the text. The black circles with error-bars show molecular column densities calculated at a fixed temperature and density.
Current usage metrics show cumulative count of Article Views (full-text article views including HTML views, PDF and ePub downloads, according to the available data) and Abstracts Views on Vision4Press platform.
Data correspond to usage on the plateform after 2015. The current usage metrics is available 48-96 hours after online publication and is updated daily on week days.
Initial download of the metrics may take a while.