Fig. 8.
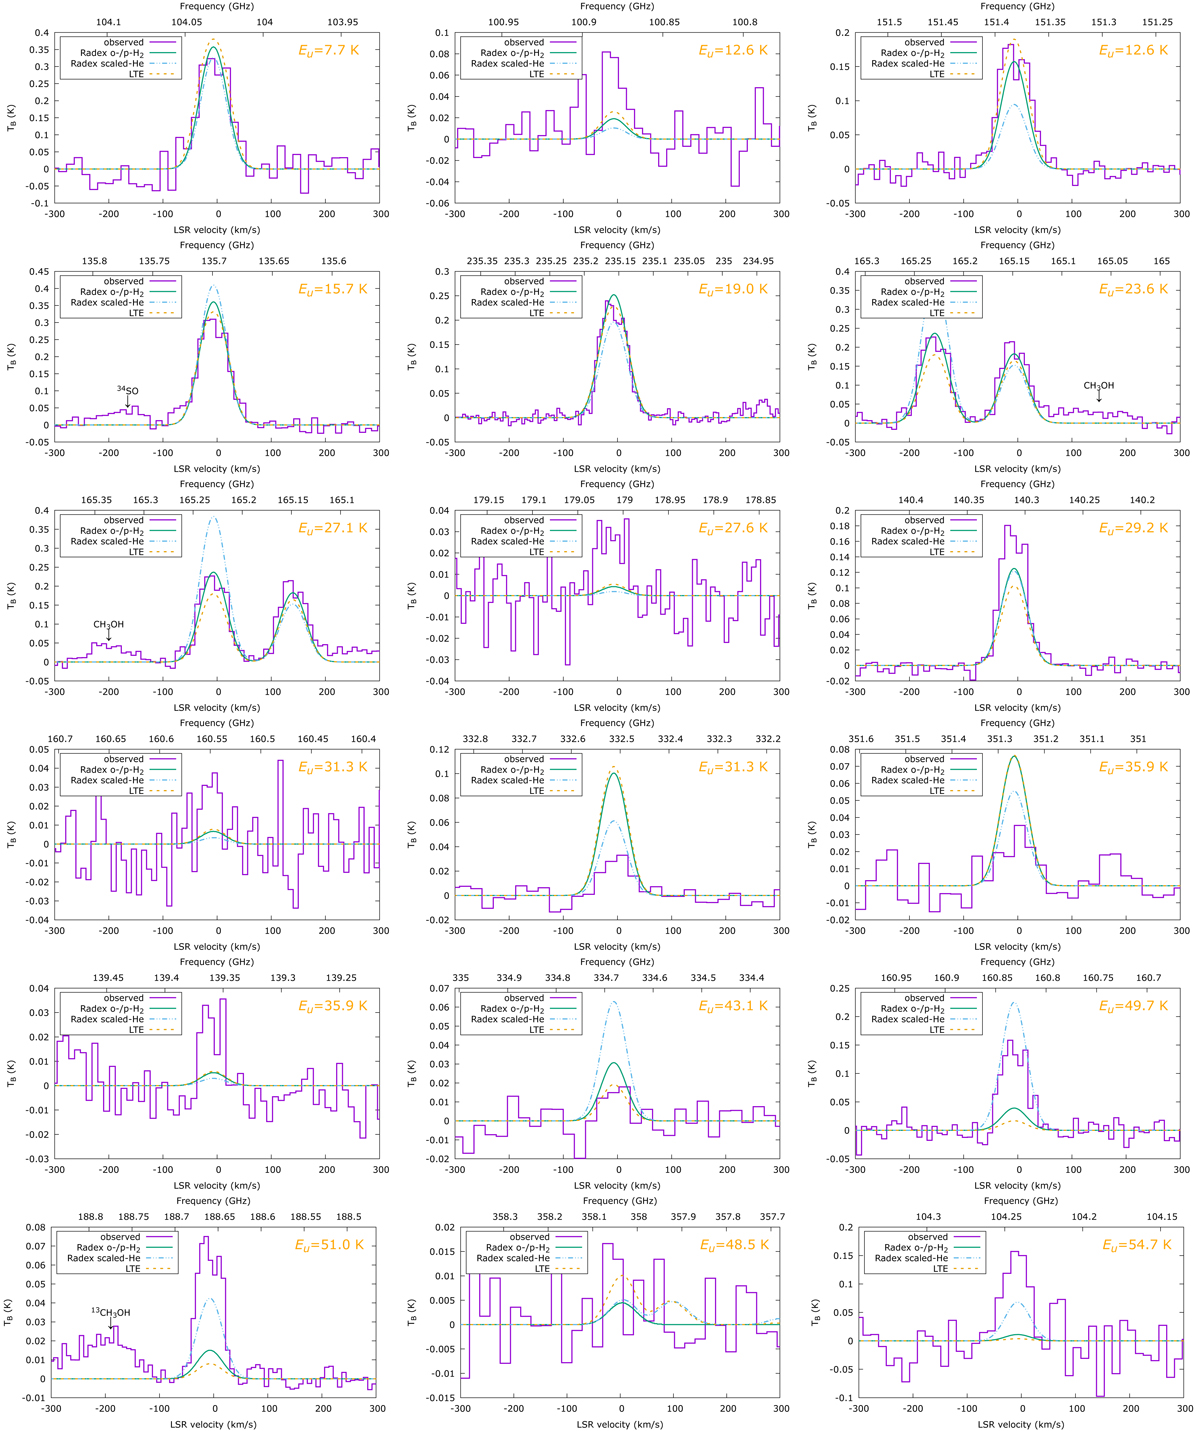
Observed (histogram) and simulated spectra (lines) of selected SO2 transitions in the central region of the remnant. The simulations include the best LTE model (dashed; Tex = 7.7 K and N = 8.3 × 1015 cm−2), the best RADEX model with collisional rates of ortho and para H2 (solid; Tkin = 10.7 K and N = 5.4 × 1015 cm−2), and the best RADEX model with collisional rates of H2 scaled from calculations of collisions with He (dashed-dotted; Tkin = 19.4 K and N = 5.1 × 1015 cm−2). Since both collision partners are abundant in CK Vul, we are not able to indicate which of the two models is more adequate. This illustrates one of limitations of the non-LTE excitation analysis. Column densities are given for a beam filling factor of 0.41. Main species whose lines are contaminating the spectra of SO2 are indicated. Panels are ordered with increasing Eu from left to right and from top to bottom.
Current usage metrics show cumulative count of Article Views (full-text article views including HTML views, PDF and ePub downloads, according to the available data) and Abstracts Views on Vision4Press platform.
Data correspond to usage on the plateform after 2015. The current usage metrics is available 48-96 hours after online publication and is updated daily on week days.
Initial download of the metrics may take a while.