Fig. 7.
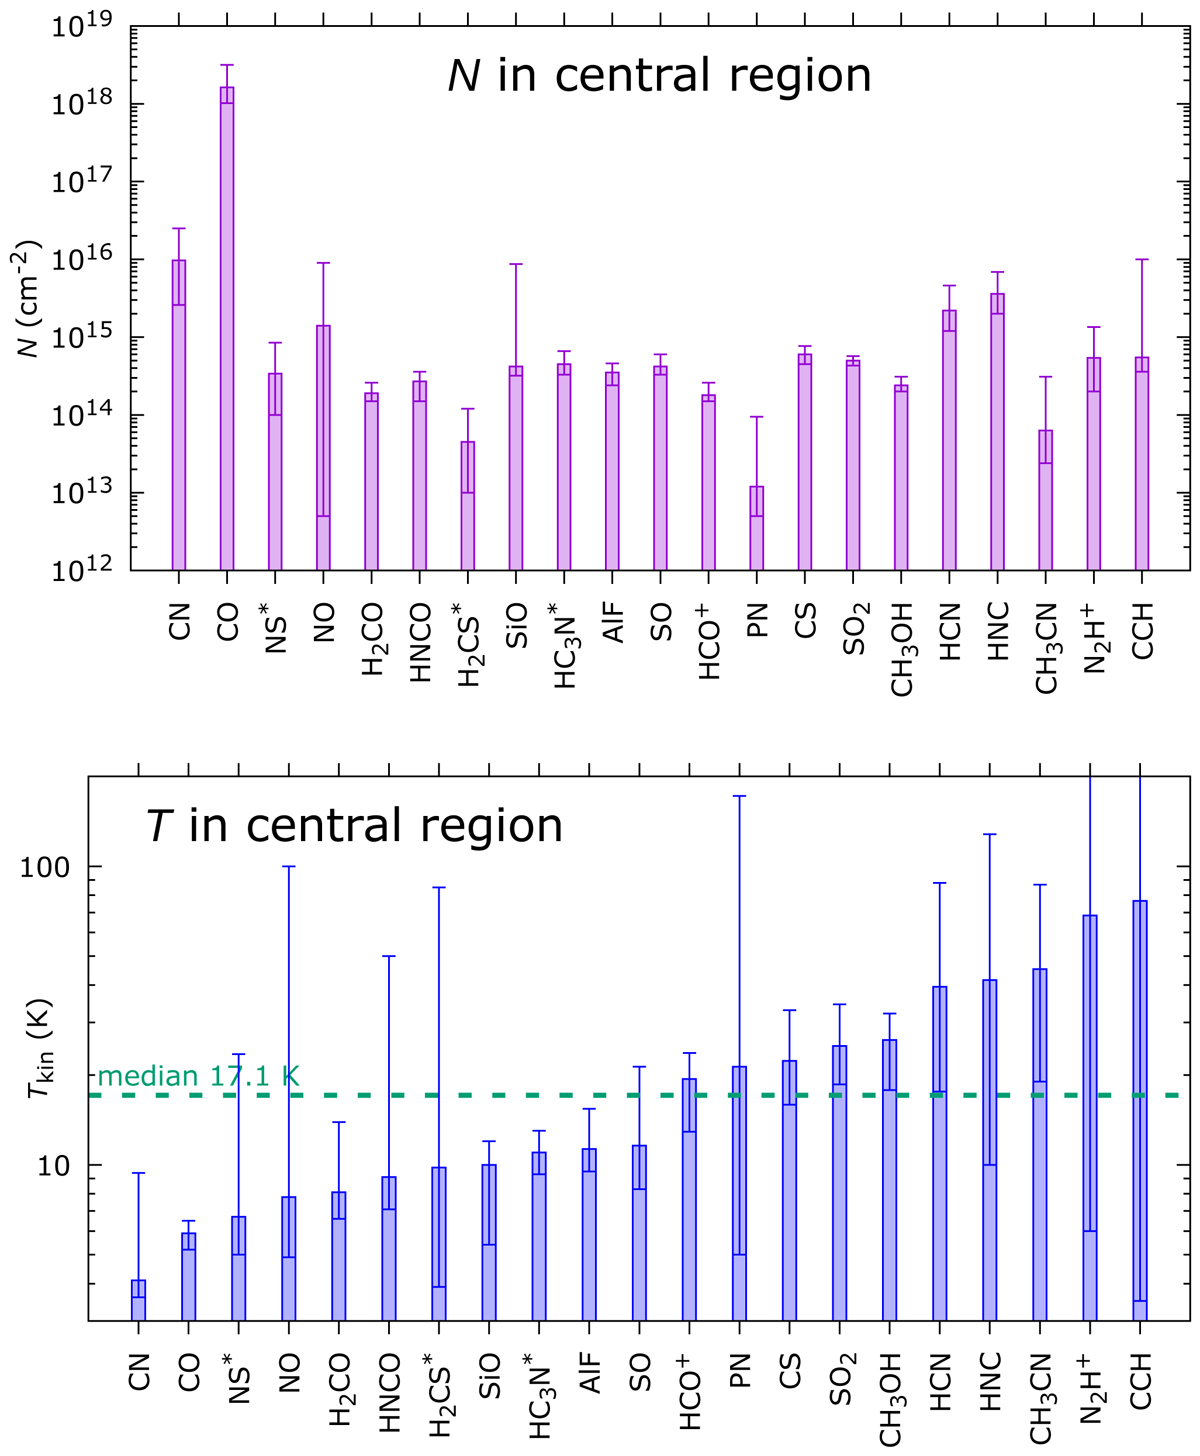
Column densities (top) and temperatures (bottom) of molecules in the central region. The error-bars represent 3σ uncertainties derived by the χ2 minimization procedure. The errors are largely underestimated. The column densities represent the main isotopologues of the species. A correction of about 20% and 30% is necessary for O- and C-bearing molecules to account for the presence of 17O and 13C, respectively. The vertical dashed line shows the median temperature of 17.1 K. For molecules labeled with an asterisk, LTE results instead of non-LTE are presented.
Current usage metrics show cumulative count of Article Views (full-text article views including HTML views, PDF and ePub downloads, according to the available data) and Abstracts Views on Vision4Press platform.
Data correspond to usage on the plateform after 2015. The current usage metrics is available 48-96 hours after online publication and is updated daily on week days.
Initial download of the metrics may take a while.