Fig. 3.
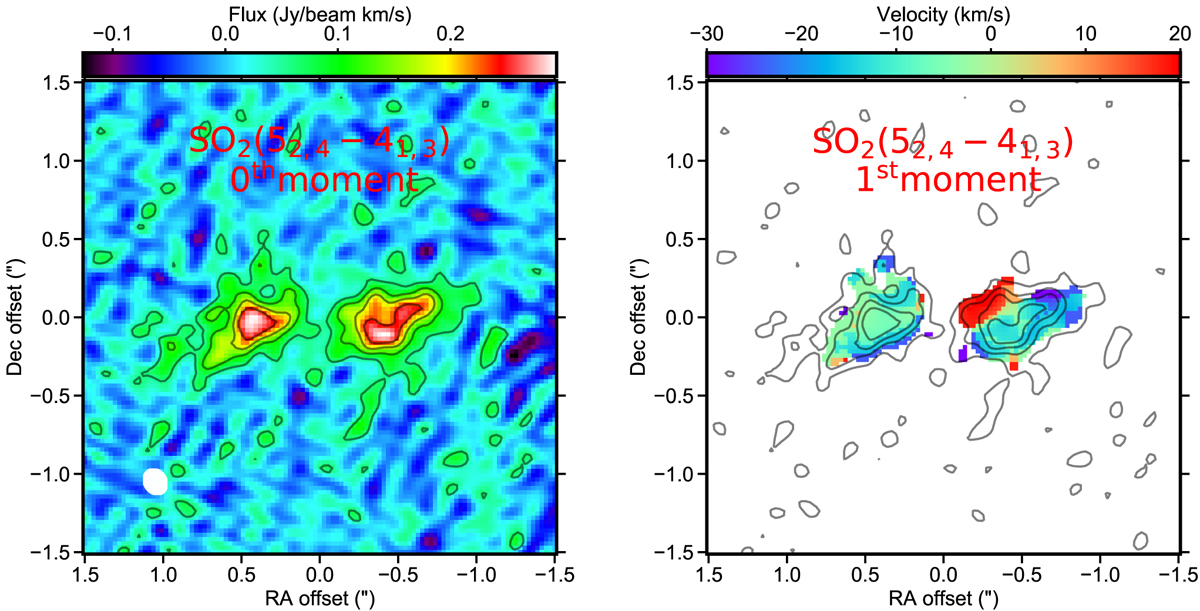
Maps of the SO2 52, 4 − 41, 3 transition. Left panel: total intensity map. Right panel: first-moment map for emission above the 4σ noise level in the original data cube. Both maps present contours of the total intensity at 20, 40, 60, and 80% of the peak emission. The input data were restored with uniform weighting of the visibilities, resulting in a synthesized beam of size ![]() (shown as white ellipse in the left panel).
(shown as white ellipse in the left panel).
Current usage metrics show cumulative count of Article Views (full-text article views including HTML views, PDF and ePub downloads, according to the available data) and Abstracts Views on Vision4Press platform.
Data correspond to usage on the plateform after 2015. The current usage metrics is available 48-96 hours after online publication and is updated daily on week days.
Initial download of the metrics may take a while.