Fig. 2.
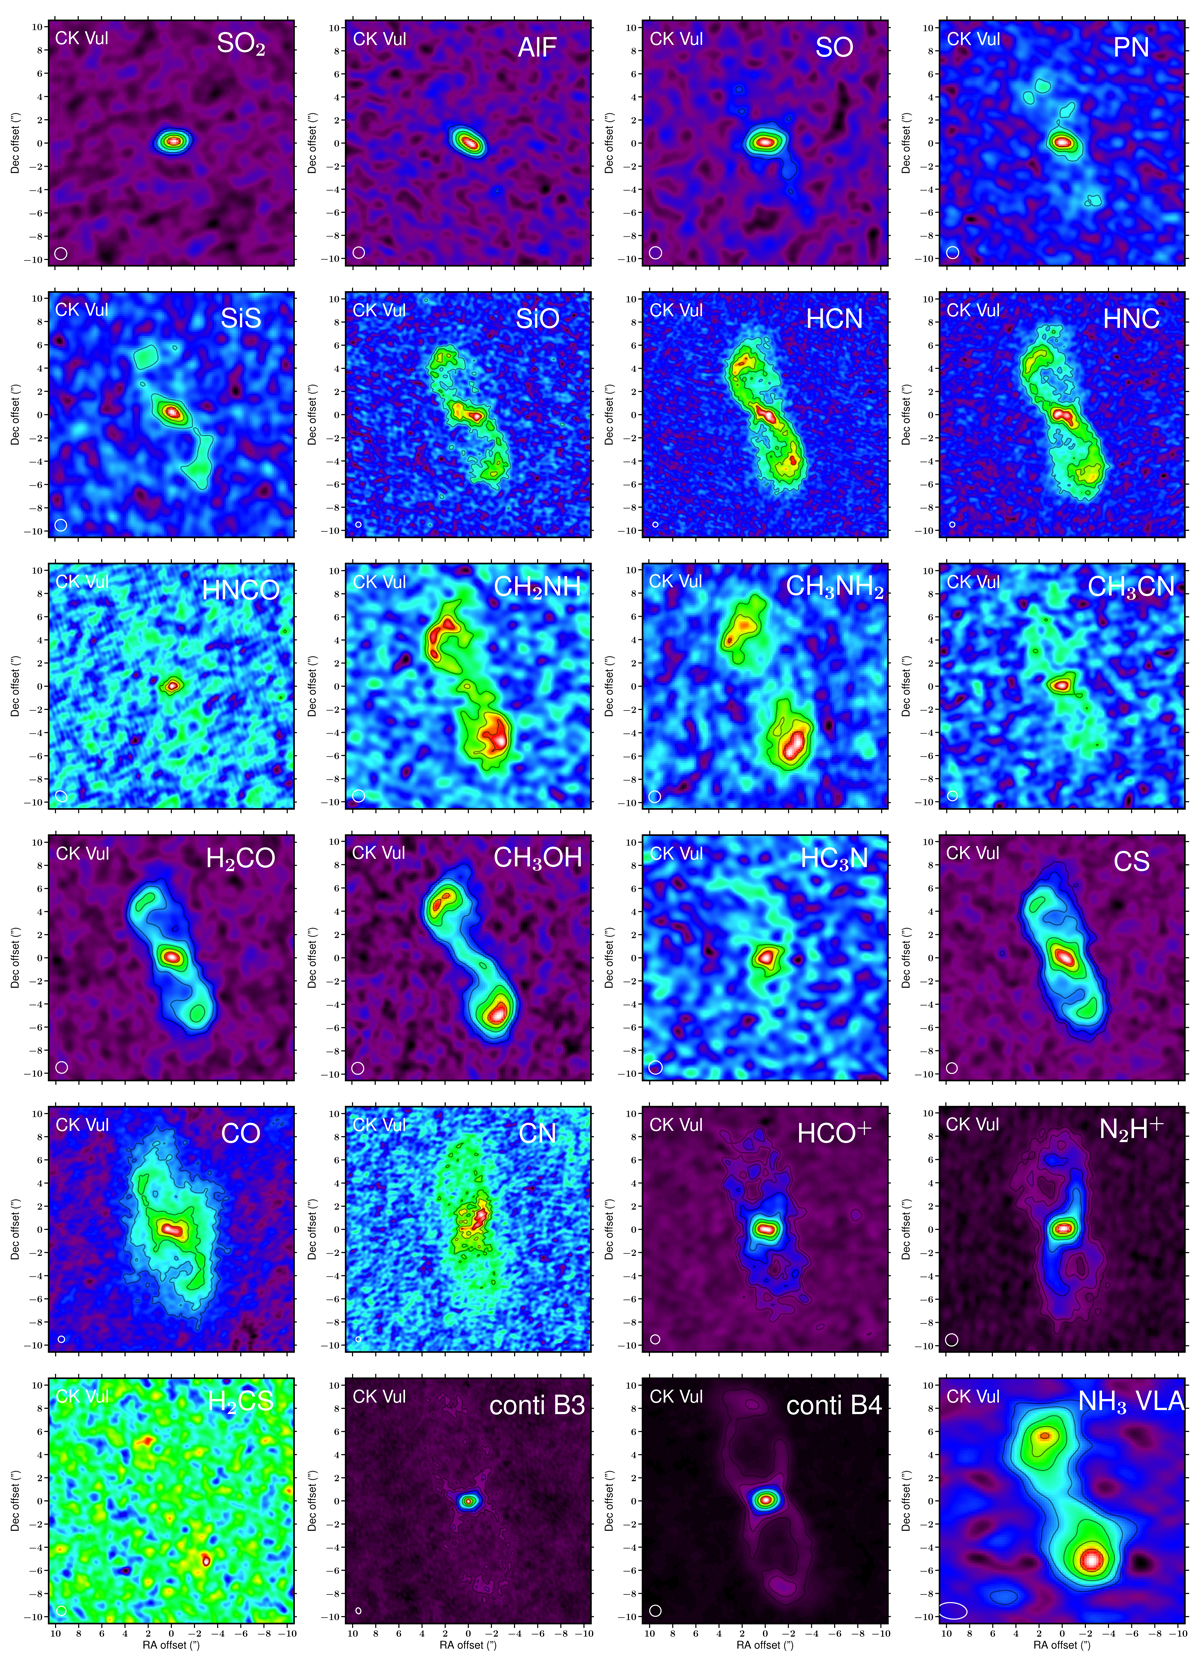
Maps of molecular and continuum emission in CK Vul. Each map shows the weighted mean of the emission in multiple transitions of the given species and its isotopologues. Contours are drawn at 2.5, 5, 10, 20, 40, 80% of the emission peak in each map starting from a level above the respective 3 × rms noise. Continuum emission in bands 3 and 4 is imaged at a very high S/N, but is presented in the same linear color scale as the other maps. For completeness, we add a map of NH3 obtained with VLA (right panel) with a non-circular restoring beam.
Current usage metrics show cumulative count of Article Views (full-text article views including HTML views, PDF and ePub downloads, according to the available data) and Abstracts Views on Vision4Press platform.
Data correspond to usage on the plateform after 2015. The current usage metrics is available 48-96 hours after online publication and is updated daily on week days.
Initial download of the metrics may take a while.