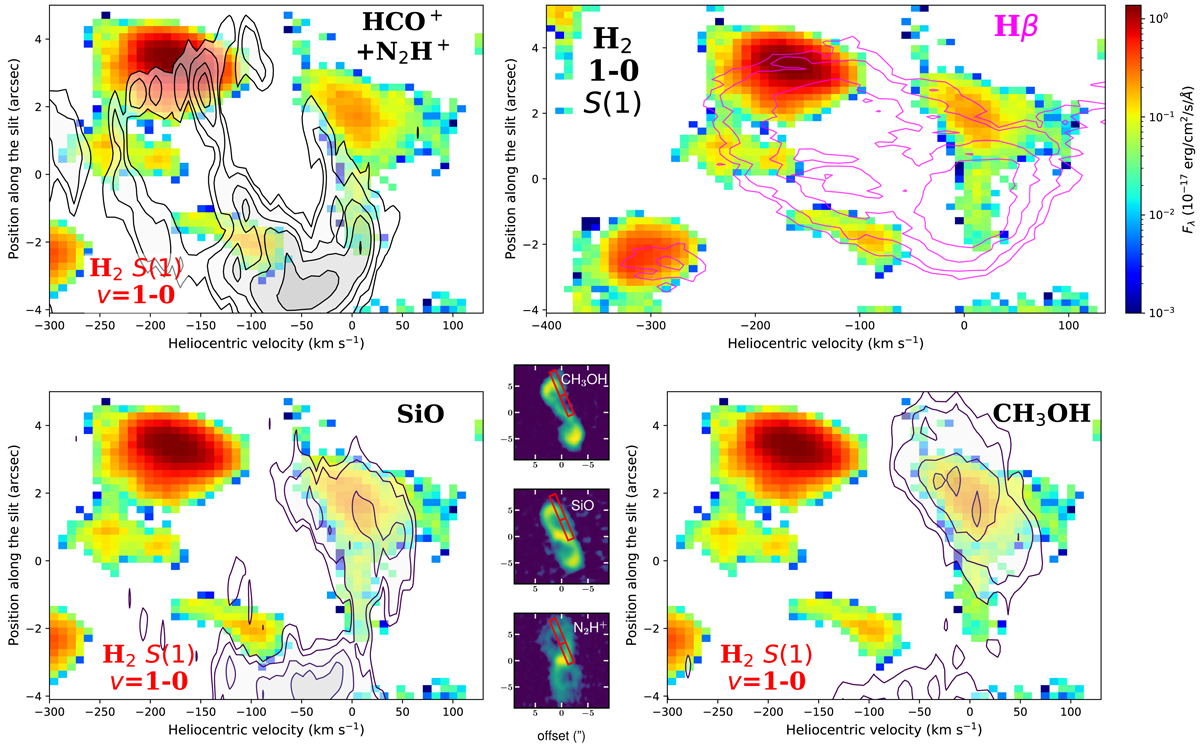
Fig. 13.

Comparison of different phases of gas emission along the X-shooter slit. The main four corner panels show position-velocity diagrams with the emission of the H2v = 1−0 S(1) line shown in color. The emission of SiO (bottom left), CH3OH (bottom right), and molecular ions (top left) was extracted from ALMA cubes representing average of multiple transitions of the species. (The emission at velocities < 250 km s−1 in the map of the ions comes from a nearby line of other species and should be ignored). The emission in the optical Balmer Hβ line (top right, magenta) and that of H2 come directly from the X-shooter observations (Sect. 2.4; see also Tylenda et al. 2019). Note the span of radial velocities is wider in the panel presenting data for Hβ. The contours are drawn at 3, 5, 10, 15, and 30, times the rms noise of the respective map. The inset in the middle of the bottom raw shows as a red rectangle the region probed in the position-velocity diagrams. It is overlaid on maps the emission of CH3OH, SiO, and N2H+ (the same as in Fig. 2). The RA and Dec offsets in the inset are given in arcsec. Position along the slit is shown negative for regions south of the line dividing the rectangle. The position-velocity diagrams show a reduced range of offsets compared to the original extent of the X-shooter slit to avoid a contamination from a background star at offsets < − 4″ (cf. Tylenda et al. 2019).
Current usage metrics show cumulative count of Article Views (full-text article views including HTML views, PDF and ePub downloads, according to the available data) and Abstracts Views on Vision4Press platform.
Data correspond to usage on the plateform after 2015. The current usage metrics is available 48-96 hours after online publication and is updated daily on week days.
Initial download of the metrics may take a while.


