Fig. 3
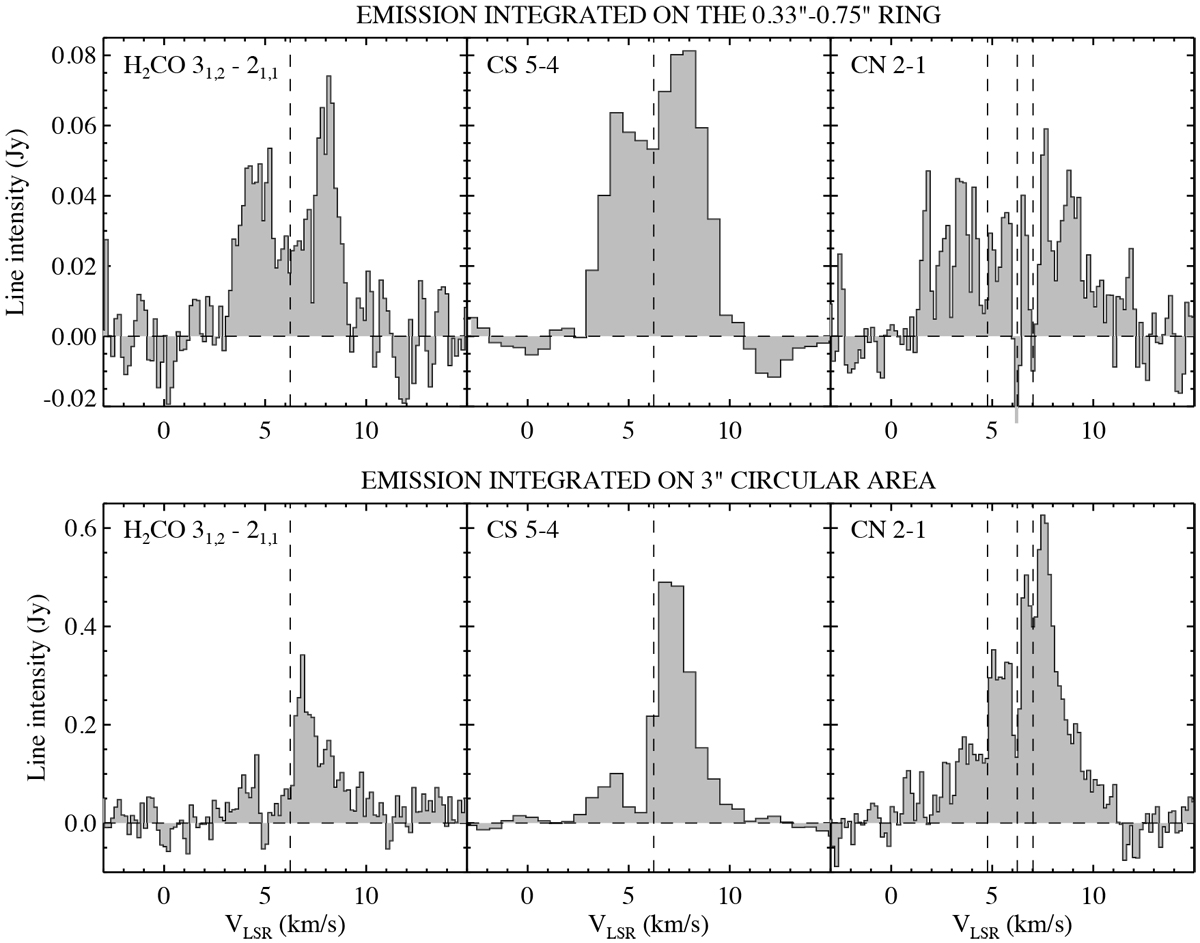
H2CO 31,2 − 21,1, CS 5− 4, and CN 2−1 spectra integrated over a 0′′.33–0′′.75 ring area (top panels) and over a 3′′ circular area (bottom panels). The vertical dashed lines indicate the systemic velocity, Vsys = + 6.24 km s−1. For CN 2−1, the velocity scale corresponds to the brightest of the three hyperfine components at 226.87 GHz reported in Table 1 (N = 2−1, J = 5∕2−3∕2, F = 7∕2−3∕2), and the position of the two fainter components is indicated by the vertical dashed lines.
Current usage metrics show cumulative count of Article Views (full-text article views including HTML views, PDF and ePub downloads, according to the available data) and Abstracts Views on Vision4Press platform.
Data correspond to usage on the plateform after 2015. The current usage metrics is available 48-96 hours after online publication and is updated daily on week days.
Initial download of the metrics may take a while.