Fig. 2
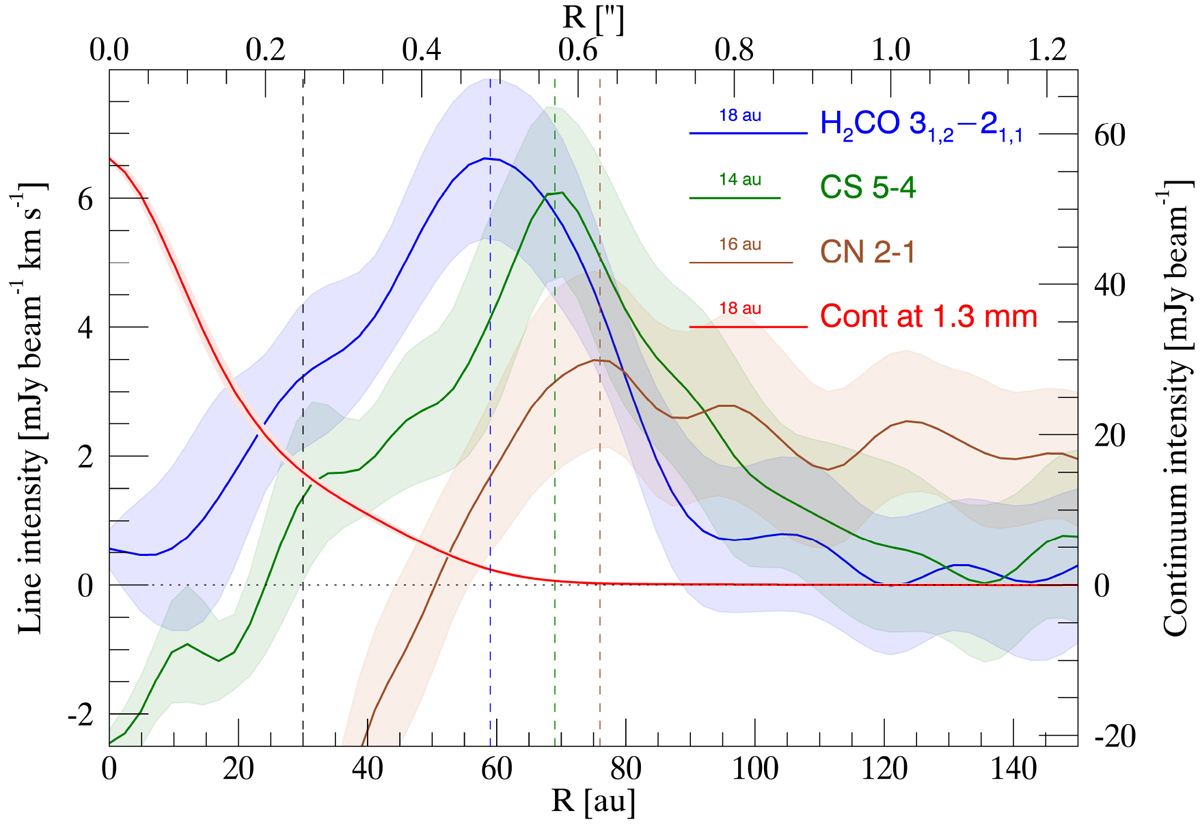
Azimuthally averaged radial intensity profile of H2CO 31,2 − 21,1 (blue), CS 5−4 (green), and CN 2−1 (brown; blending of the three components at 226.87 GHz reported in Table 1) in mJy beam−1 km s−1 (left axis), and of the 1.3 mm continuum (red) in mJy beam−1(right axis). The radial distance is indicated in au on the bottom axis and arcseconds on the top axis. The angular resolution of the lines/continuum profiles is indicated by the corresponding horizontal lines. The shaded areas indicate the dispersion of the intensity values around the mean along each annulus in the radial direction. The vertical dashed lines indicate the position of the CO snowline (black), and of the peaks of the emission in H2 CO 31,2 − 21,1 (blue), CS 5−4 (green), and CN 2−1 (brown).
Current usage metrics show cumulative count of Article Views (full-text article views including HTML views, PDF and ePub downloads, according to the available data) and Abstracts Views on Vision4Press platform.
Data correspond to usage on the plateform after 2015. The current usage metrics is available 48-96 hours after online publication and is updated daily on week days.
Initial download of the metrics may take a while.