Fig. 1
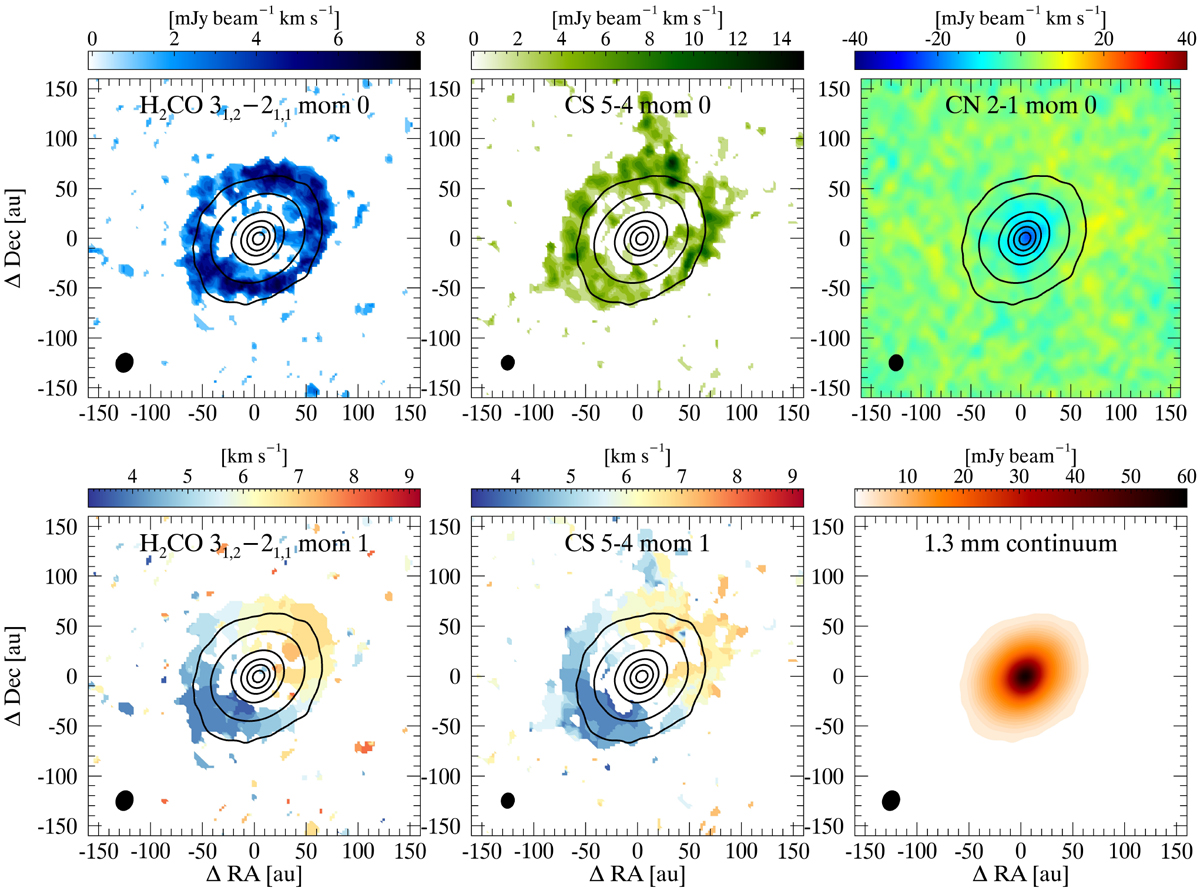
Moment-0 maps (top panels) of H2CO 31,2 − 21,1 (left), CS 5−4 (middle), and CN 2−1 (right; blending of the three components at 226.87 GHz reported in Table 1) towards DG Tau. The corresponding moment-1 maps are shown in the bottom left and middle panels, while no moment-1 map is shown for CN 2− 1 because of the blending of the three hyperfine components. Bottom right panel: map of the continuum emission at 1.3 mm. The color scale indicates the line intensity in mJy beam−1km s−1 (moment-0),the velocity VLSR in km s−1 (moment-1), and the intensity in mJy beam−1 (for the continuum map). The black contours indicate the 1.3 mm dust continuum emission (0.01% corresponding to the 5σ level, 10, 30,50, 70, and 90% contours). The ellipse in the bottom left corner of each panel shows the ALMA synthesized beam.
Current usage metrics show cumulative count of Article Views (full-text article views including HTML views, PDF and ePub downloads, according to the available data) and Abstracts Views on Vision4Press platform.
Data correspond to usage on the plateform after 2015. The current usage metrics is available 48-96 hours after online publication and is updated daily on week days.
Initial download of the metrics may take a while.