Fig. 14.
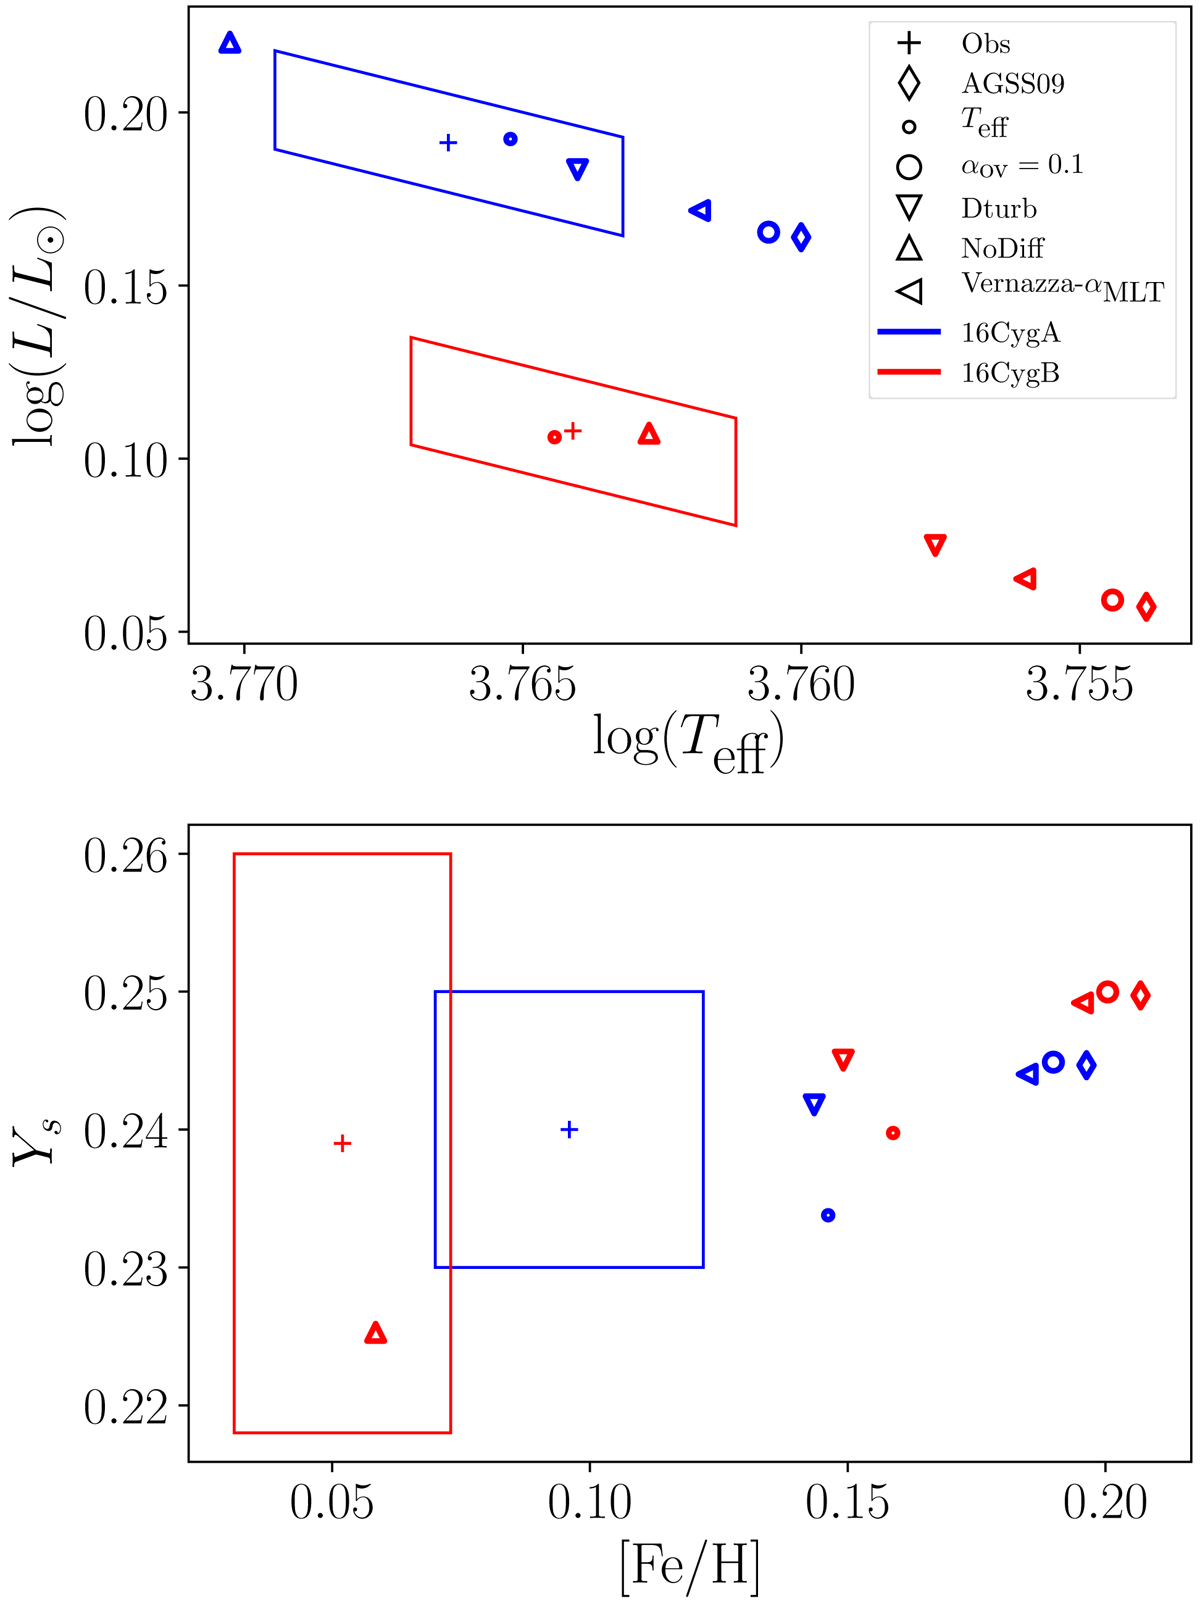
Computed values of non-seismic constraints against the observed ones, symbolised by a box, for the system seen as a whole (i.e. with common ages and initial compositions). Each variation in input physics is represented by a different symbol. The colour represents the star, blue for 16 Cyg A and red for 16 Cyg B. The upper panel is a HR diagram. The lower panel shows the surface helium abundance versus the metallicity.
Current usage metrics show cumulative count of Article Views (full-text article views including HTML views, PDF and ePub downloads, according to the available data) and Abstracts Views on Vision4Press platform.
Data correspond to usage on the plateform after 2015. The current usage metrics is available 48-96 hours after online publication and is updated daily on week days.
Initial download of the metrics may take a while.