Free Access
Fig. 1.
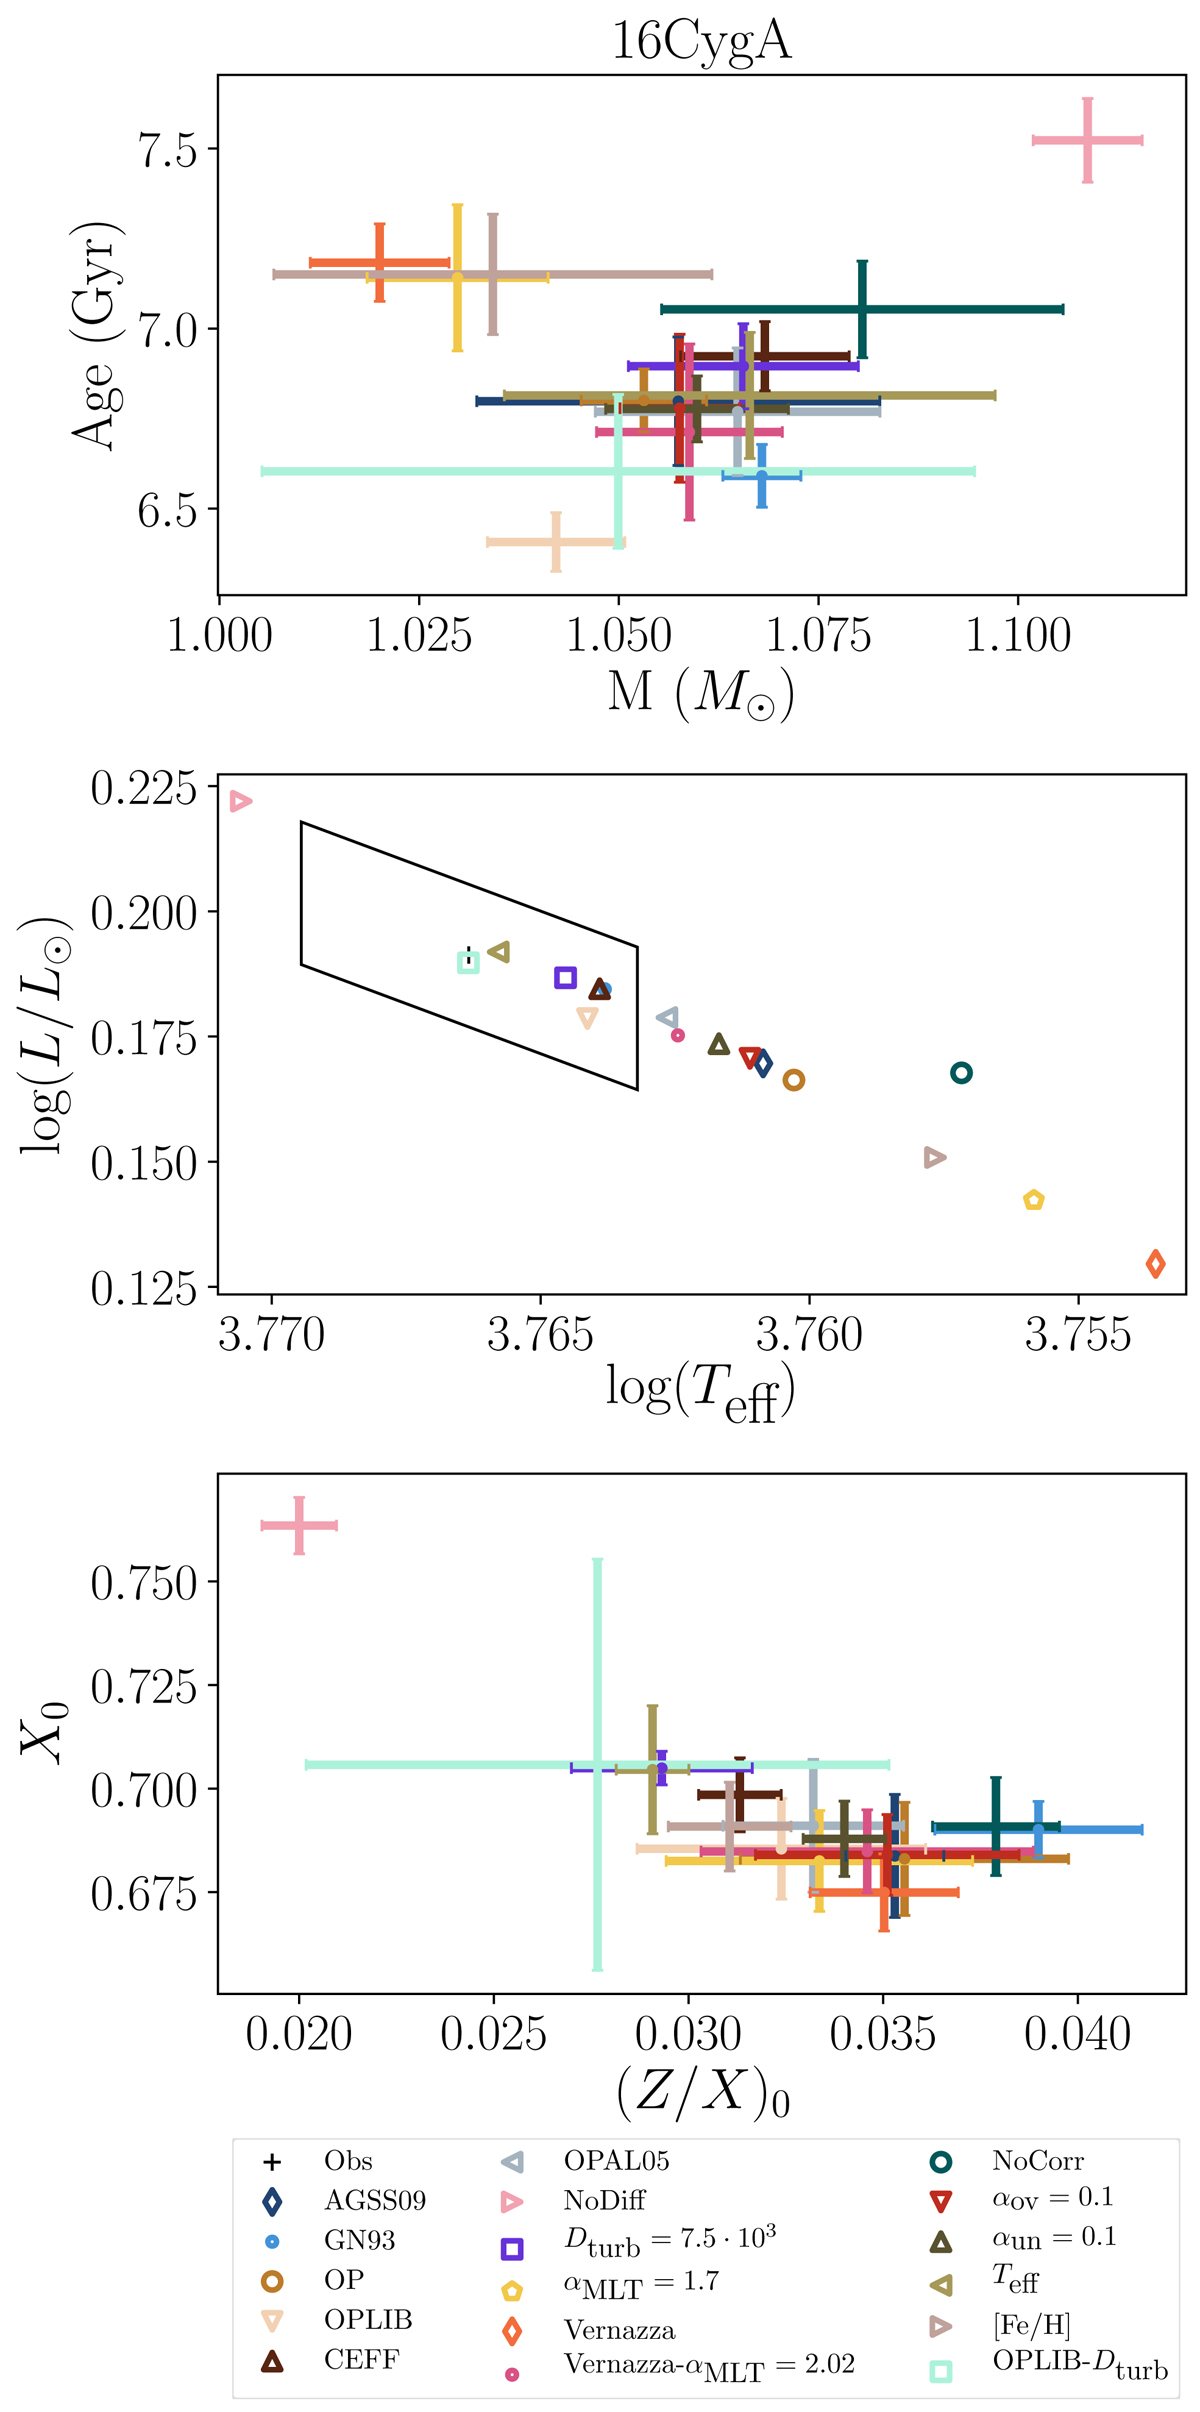
Summary of 16 Cyg A best-fit models represented in a Mass – Age diagram (top panel), HR diagram (middle panel) and initial hydrogen abundance versus metal composition diagram (bottom panel). The luminosity and effective temperature constraints from White et al. (2013) are represented in the HR diagram as a black box.
Current usage metrics show cumulative count of Article Views (full-text article views including HTML views, PDF and ePub downloads, according to the available data) and Abstracts Views on Vision4Press platform.
Data correspond to usage on the plateform after 2015. The current usage metrics is available 48-96 hours after online publication and is updated daily on week days.
Initial download of the metrics may take a while.