Fig. 9.
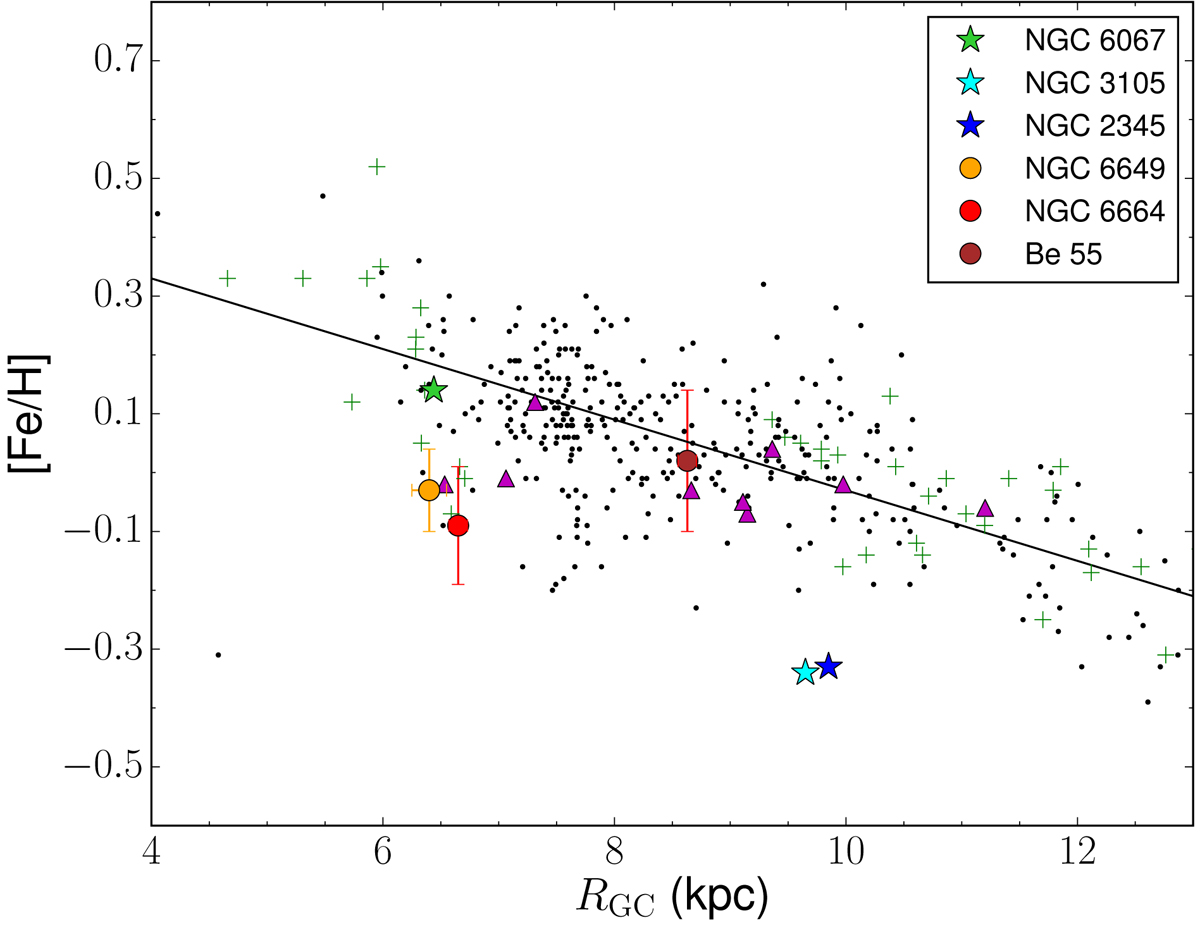
Iron abundance gradient in the Milky Way found by Genovali et al. (2013, 2014). The black line is the Galactic gradient, green crosses are Cepheids studied in those papers, whereas black dots show data for other Cepheids from literature used by these authors. Magenta triangles represent young open clusters in the sample compiled by Netopil et al. (2016). The orange circle is NGC 6649 and the red one is NGC 6664. Finally, other clusters analysed by our group with the same technique are marked with star symbols. All the values shown in this plot are rescaled to Genovali et al. (2014), i.e., R⊙ = 7.95 kpc and A(Fe) = 7.50.
Current usage metrics show cumulative count of Article Views (full-text article views including HTML views, PDF and ePub downloads, according to the available data) and Abstracts Views on Vision4Press platform.
Data correspond to usage on the plateform after 2015. The current usage metrics is available 48-96 hours after online publication and is updated daily on week days.
Initial download of the metrics may take a while.