Fig. 10.
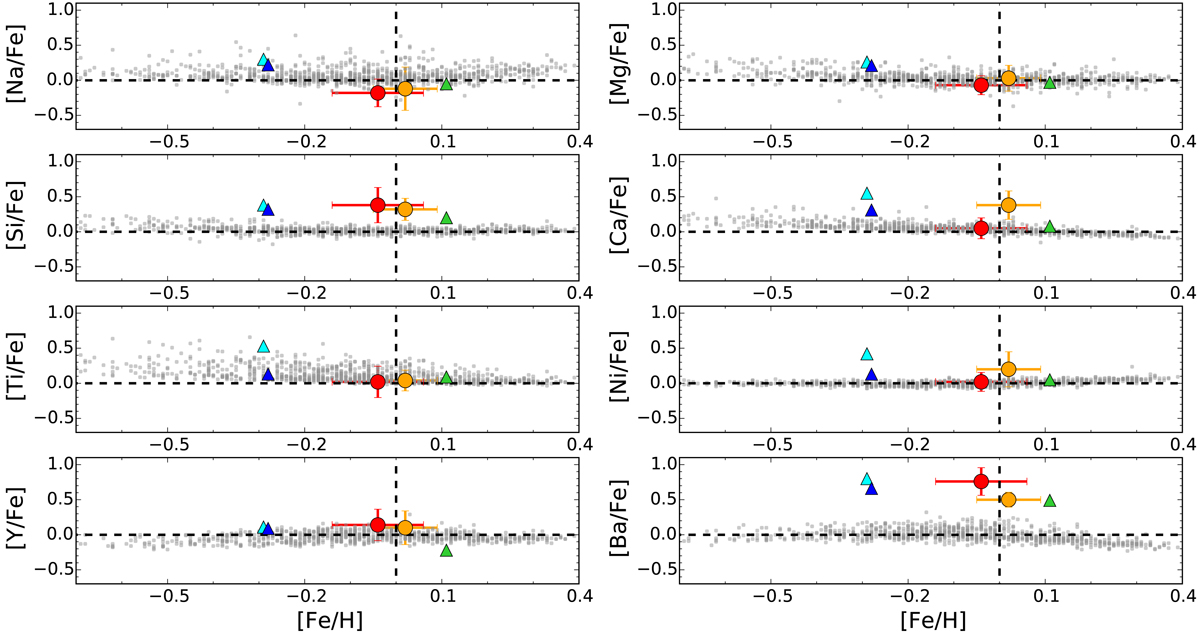
Abundance ratios [X/Fe] versus [Fe/H]. The grey dots represent the Galactic trends for the thin disc (Adibekyan et al. 2012; Delgado Mena et al. 2017). NGC 6067, NGC 3105 and NGC 2345 are drawn with triangles (green, cyan, and blue, respectively), whereas NGC 6649 and NGC 6664 are the orange and red circles, respectively. Clusters are represented by their mean values. The dashed lines indicate the solar value.
Current usage metrics show cumulative count of Article Views (full-text article views including HTML views, PDF and ePub downloads, according to the available data) and Abstracts Views on Vision4Press platform.
Data correspond to usage on the plateform after 2015. The current usage metrics is available 48-96 hours after online publication and is updated daily on week days.
Initial download of the metrics may take a while.