Fig. 3
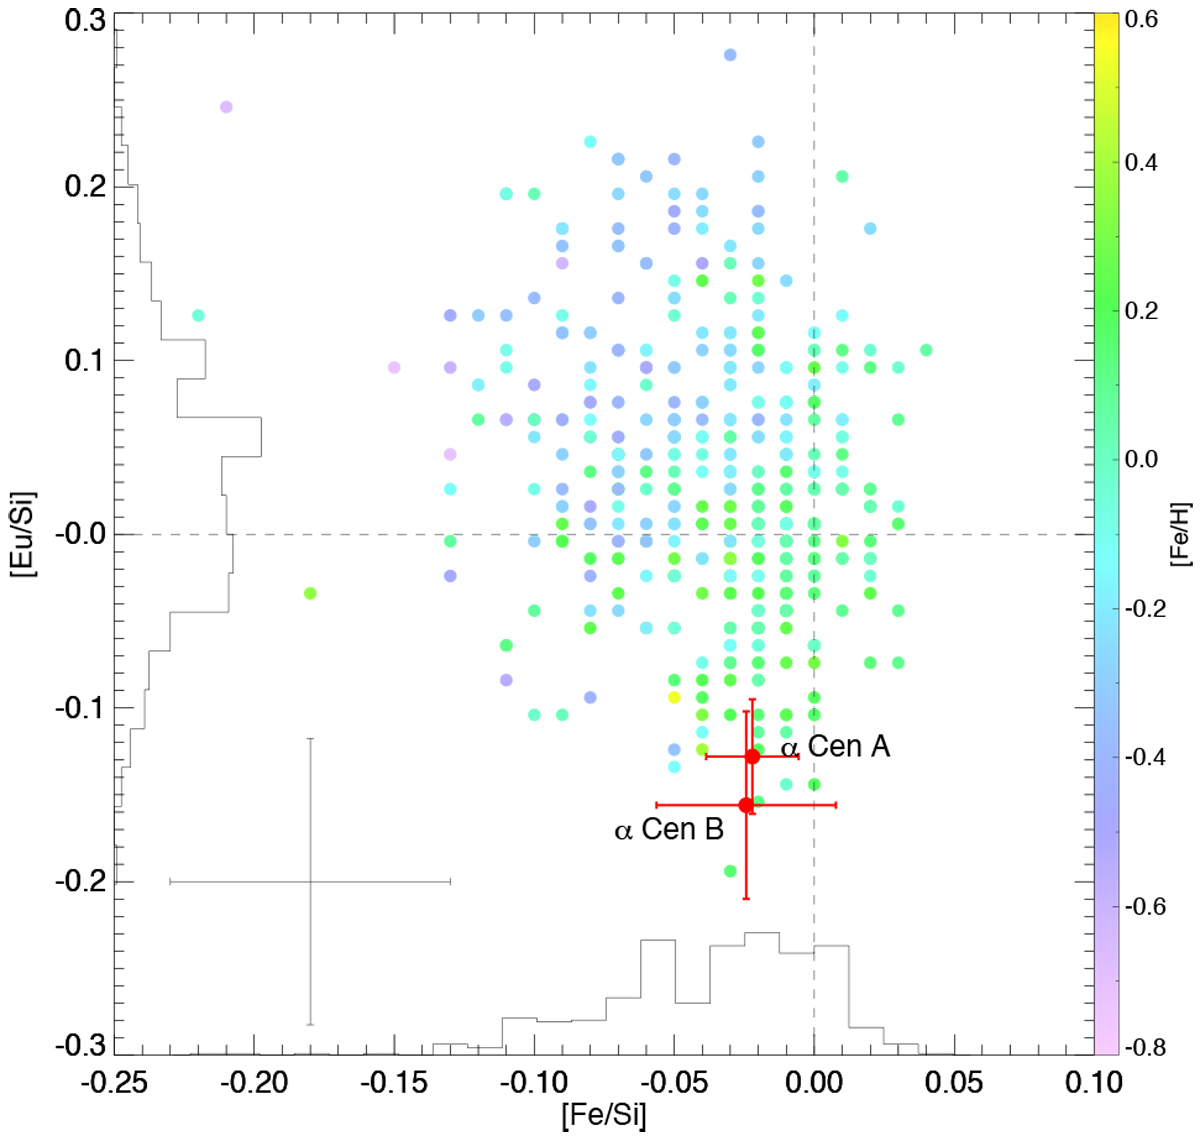
Our abundance results for α Cen A and Boverlaid on the [Eu/Si]-[Fe/Si] diagram for the sample of thin-disc stars (colour-coded as a function of [Fe/H]) of Delgado Mena et al. (2019). Their typical uncertainties are indicated in the bottom left corner. The histograms on the x-axis and y-axis show the respective distributions of [Fe/Si] and [Eu/Si] of these thin-disc stars. The horizontal and vertical dashed lines indicate the zero-points of the diagram (solar).
Current usage metrics show cumulative count of Article Views (full-text article views including HTML views, PDF and ePub downloads, according to the available data) and Abstracts Views on Vision4Press platform.
Data correspond to usage on the plateform after 2015. The current usage metrics is available 48-96 hours after online publication and is updated daily on week days.
Initial download of the metrics may take a while.