Fig. 1
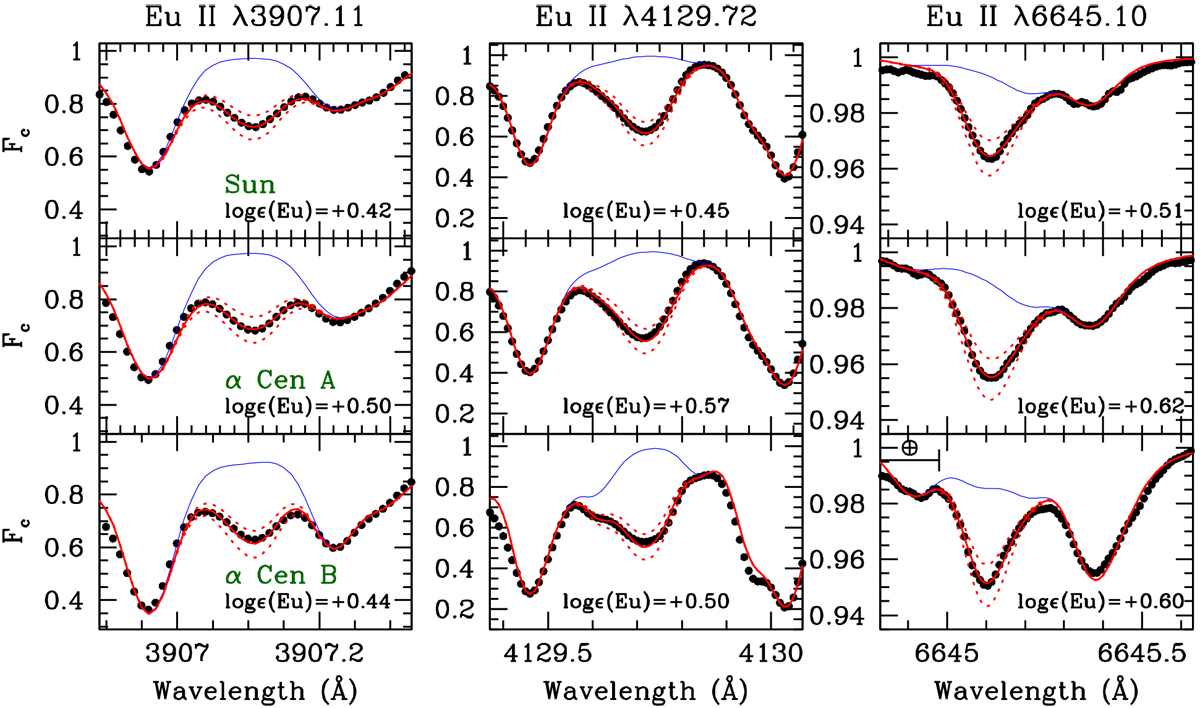
Examples of fits to the Eu II spectral features in the Sun (top panels) and α Cen AB (middle and bottom panels) based on the line list of Me14. The solid red line shows the best-fitting synthetic profile, while the two dotted lines show the profiles for an Eu abundance deviating by ± 0.1 dex. The blue line shows the profile without Eu. The best-fitting abundance is indicated in each case. The ordinate scale for Eu II λ6645 differs strongly. The Earth symbol in the bottom right panel marks the location of telluric features (the Sun and α Cen A are not significantly affected).
Current usage metrics show cumulative count of Article Views (full-text article views including HTML views, PDF and ePub downloads, according to the available data) and Abstracts Views on Vision4Press platform.
Data correspond to usage on the plateform after 2015. The current usage metrics is available 48-96 hours after online publication and is updated daily on week days.
Initial download of the metrics may take a while.