Fig. 1.
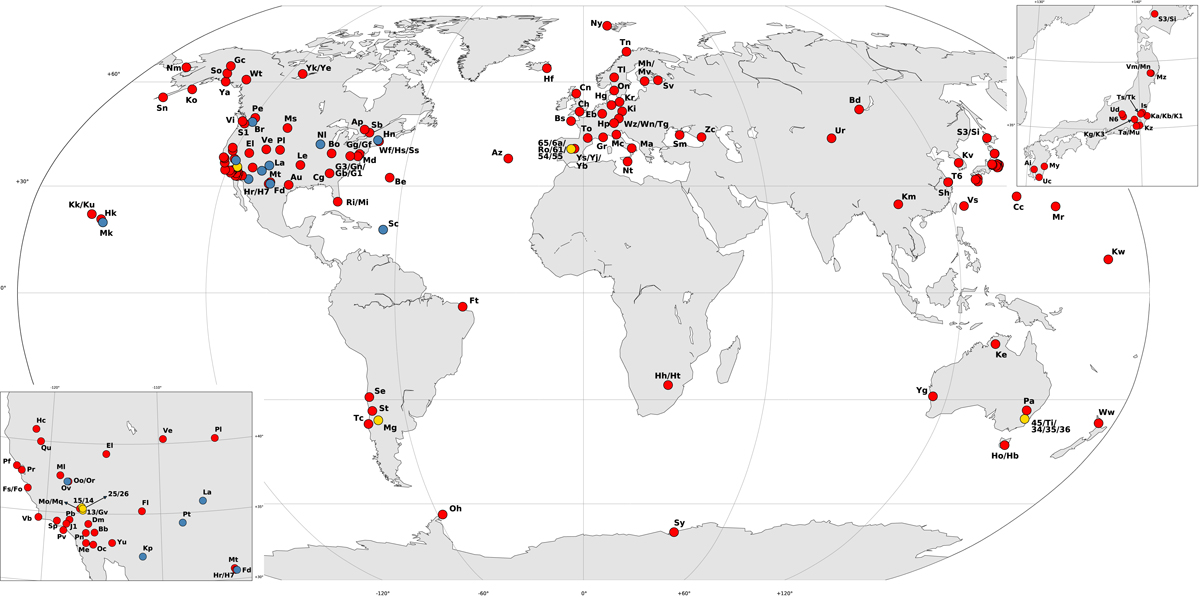
World map showing the geographical location of the 167 antennas (situated on 126 different sites) that participated in the observations used for ICRF3. The red dots show the antennas from the IVS network (and pre-existing adhoc VLBI arrays that observed at S/X band), the blue ones those from the VLBA, and the yellow ones those from the DSN and ESA. The two-character codes printed near each dot correspond to the short names of the antennas, as defined in the IVS nomenclature. The two insets show enlargements of western US and Japan where a large number of antennas (including mobile VLBI stations) have been used to collect geodetic VLBI data over the years due to the seismic nature of these regions.
Current usage metrics show cumulative count of Article Views (full-text article views including HTML views, PDF and ePub downloads, according to the available data) and Abstracts Views on Vision4Press platform.
Data correspond to usage on the plateform after 2015. The current usage metrics is available 48-96 hours after online publication and is updated daily on week days.
Initial download of the metrics may take a while.