Fig. 8.
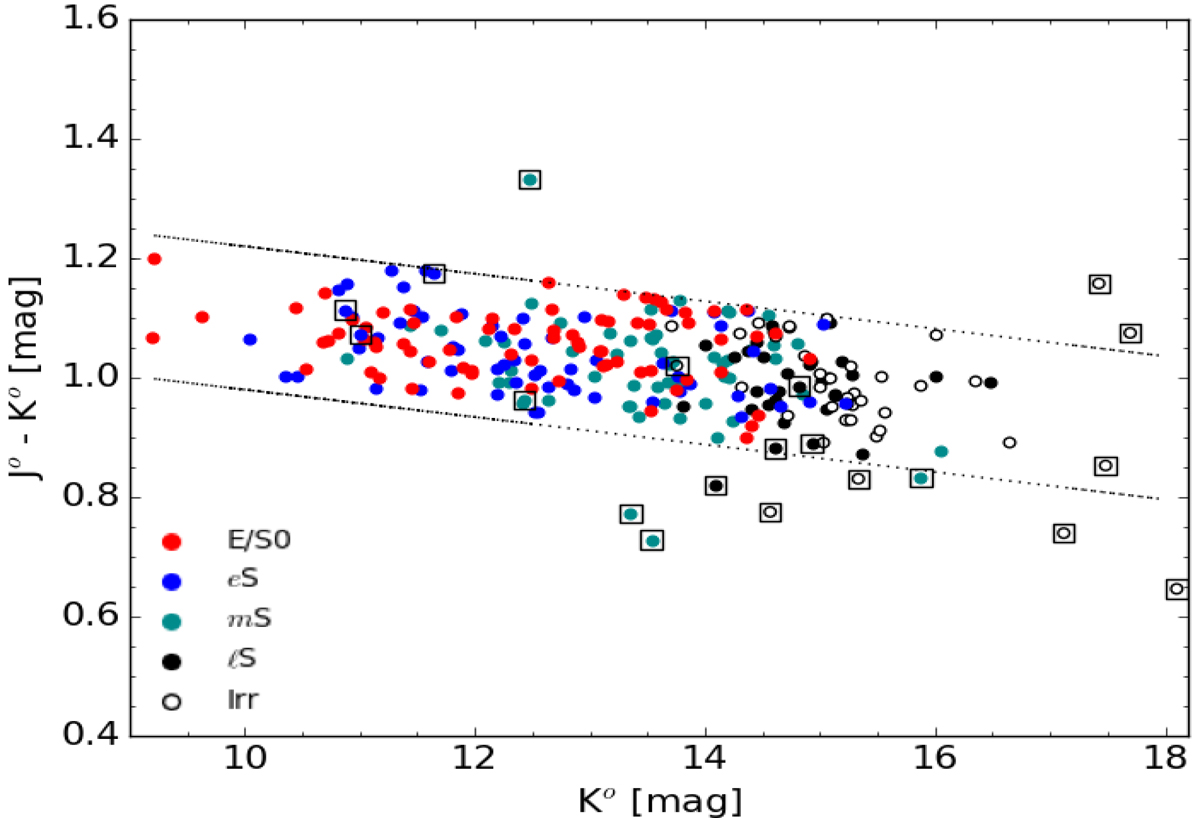
CMD of the 3C 129 cluster identified as members. Colours indicate morphological type. Circles are the red-sequence galaxies, and those enclosed in squares are H I detected galaxies within the radius and velocity range of the cluster. The dotted lines show the ±3σ rms dispersion (0.12 mag) from the fitted red sequence relation: J − K = −0.023K + 1.25.
Current usage metrics show cumulative count of Article Views (full-text article views including HTML views, PDF and ePub downloads, according to the available data) and Abstracts Views on Vision4Press platform.
Data correspond to usage on the plateform after 2015. The current usage metrics is available 48-96 hours after online publication and is updated daily on week days.
Initial download of the metrics may take a while.