Fig. 6.
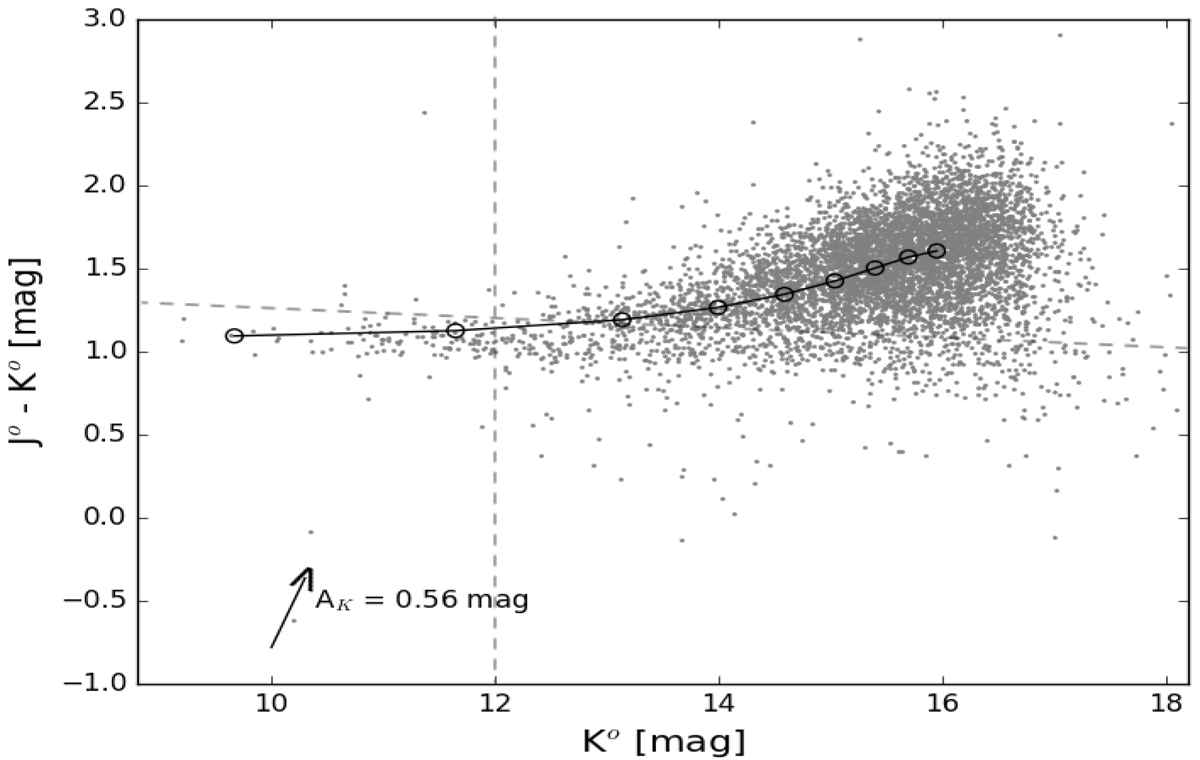
Colour-magnitude diagram of 9737 sources from the UKIDSS-GPS within the WSRT mosaic (see Sect. 2.2). The reddening curve computed from redshift z = 0.02 to z = 0.4 is shown by the black line with open circles representing the redshift bin and the Galactic dust reddening vector for a K-band extinction of 0.56 mag is indicated with the arrow. Dashed lines represent the boundaries of red sequence cluster members compared to blue outliers (vertical line) or background galaxies (slanted line).
Current usage metrics show cumulative count of Article Views (full-text article views including HTML views, PDF and ePub downloads, according to the available data) and Abstracts Views on Vision4Press platform.
Data correspond to usage on the plateform after 2015. The current usage metrics is available 48-96 hours after online publication and is updated daily on week days.
Initial download of the metrics may take a while.