Free Access
Fig. 2.
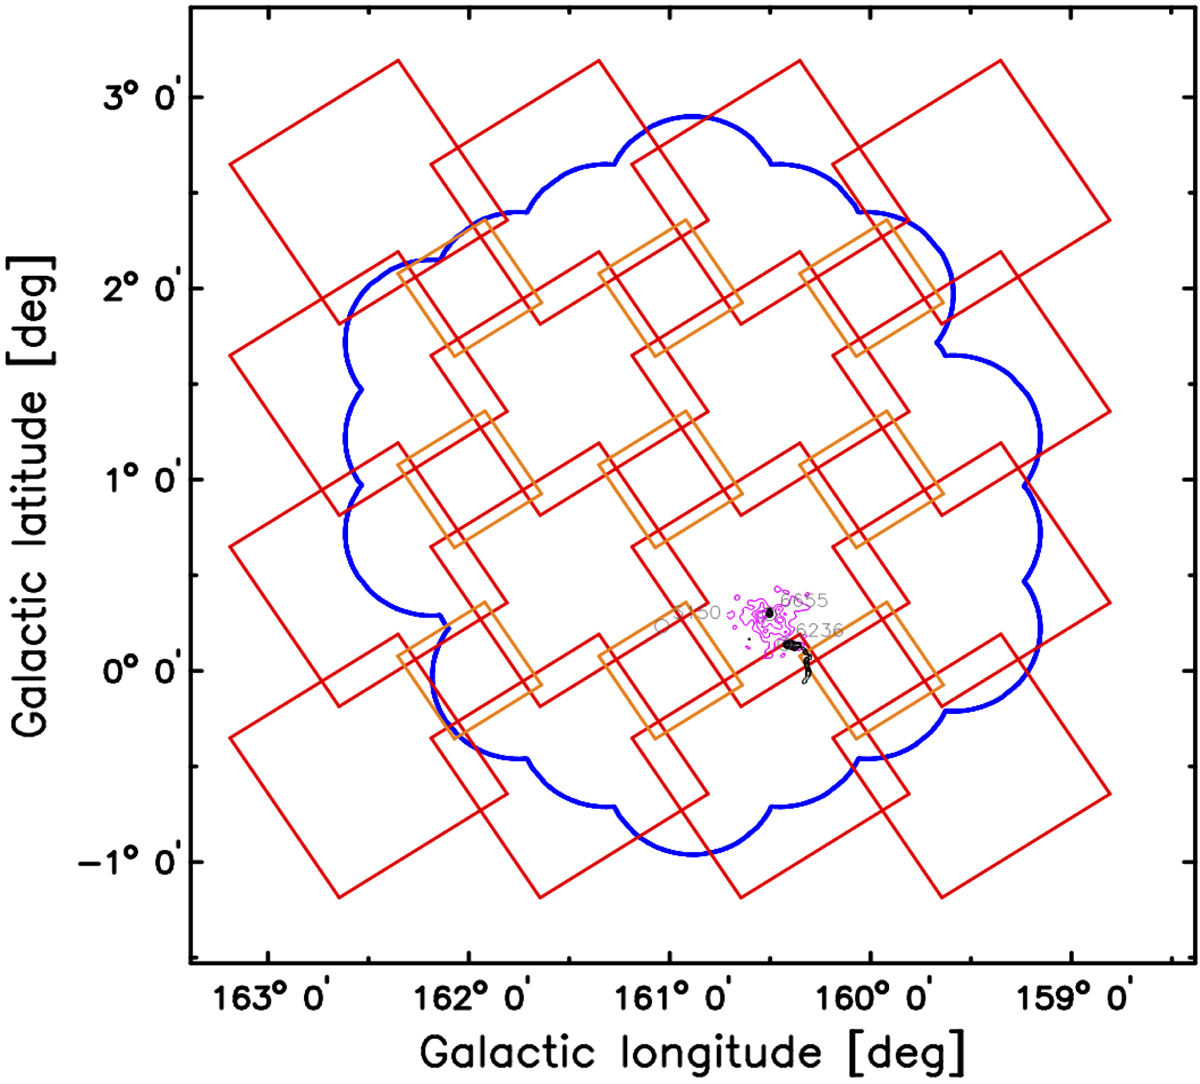
Projected sky distribution of the observed WSRT hexagonal mosaic in blue. Coverage of the near-infrared tiles from the UKIDSS – GPS data is outlined in red. The X-ray emission is shown in magenta and the position of the contours of the radio sources 3C 129 and 3C 129.1 are shown in black.
Current usage metrics show cumulative count of Article Views (full-text article views including HTML views, PDF and ePub downloads, according to the available data) and Abstracts Views on Vision4Press platform.
Data correspond to usage on the plateform after 2015. The current usage metrics is available 48-96 hours after online publication and is updated daily on week days.
Initial download of the metrics may take a while.