Fig. 16.
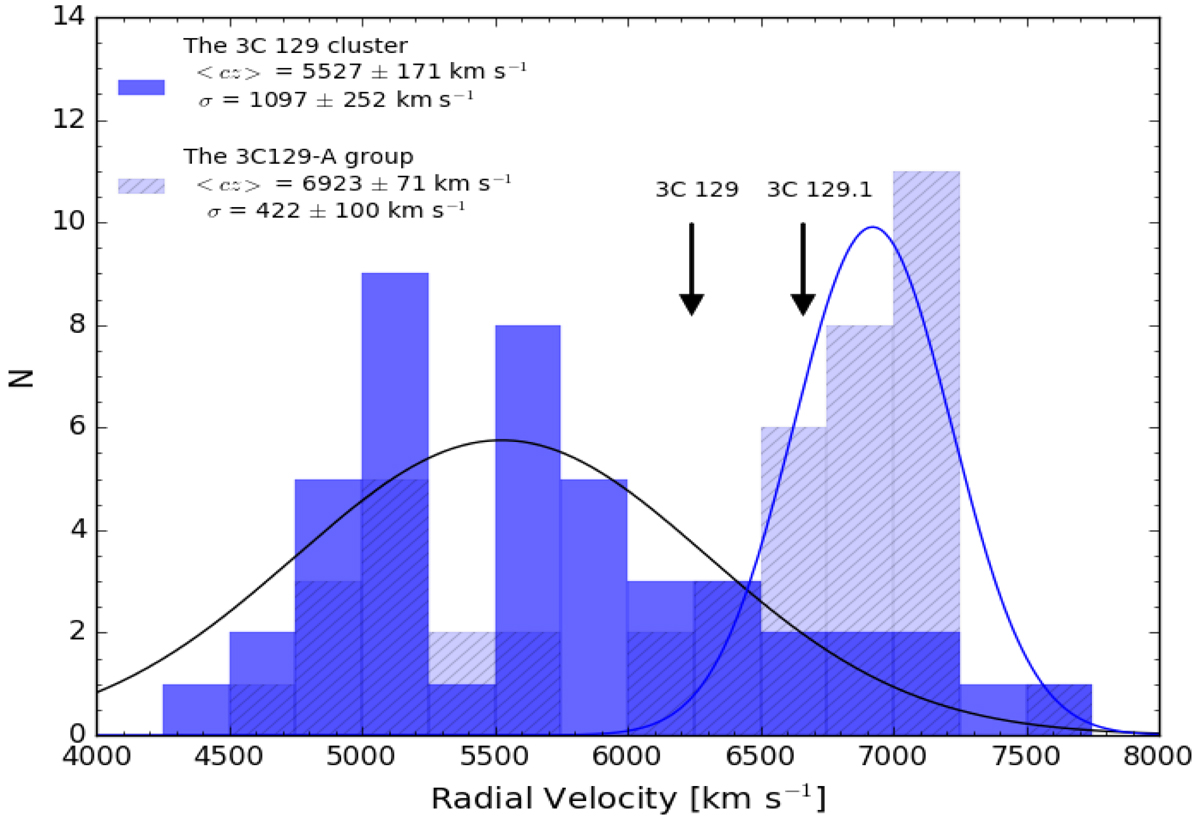
Distribution of radial velocities of the 3C 129 cluster (dark blue) and its northern substructure; 3C 129-A (hatched light blue). Velocities bins are 250 km s−1 wide. The black line is a fitted Gaussian profile of the 3C 129 cluster and blue line for the 3C 129-A group. The radial velocities of the radio sources, 3C 129 and 3C 129.1 are indicated by arrows.
Current usage metrics show cumulative count of Article Views (full-text article views including HTML views, PDF and ePub downloads, according to the available data) and Abstracts Views on Vision4Press platform.
Data correspond to usage on the plateform after 2015. The current usage metrics is available 48-96 hours after online publication and is updated daily on week days.
Initial download of the metrics may take a while.