Fig. 15.
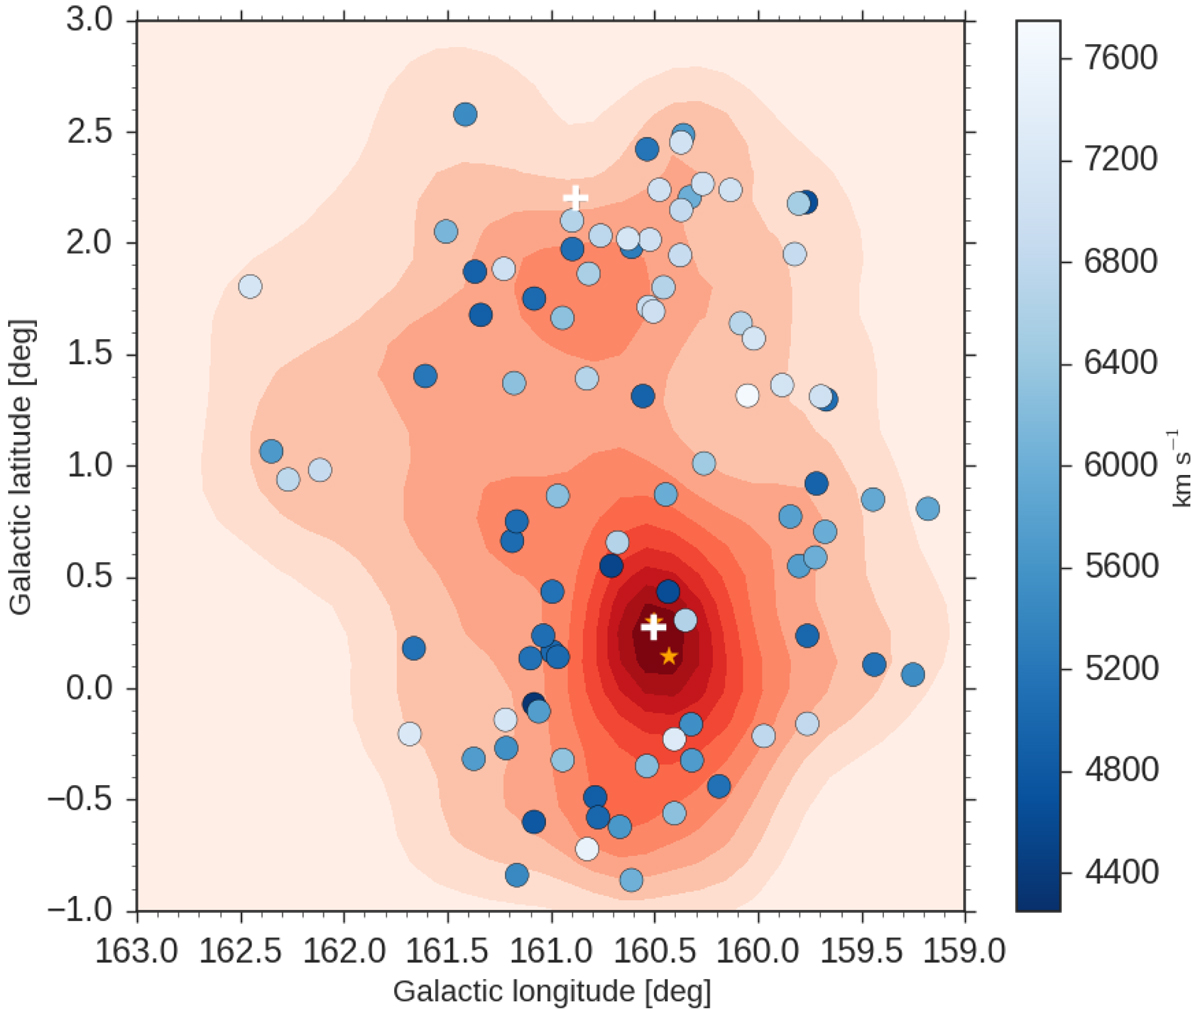
Two-dimensional kernel density map of galaxies on the red-sequence (red) in position space. Dots in gradient blues are galaxies detected in H I over the radial velocity range of the 3C 129 cluster (4000–8000 km s−1). The displayed colour bar is the velocity range of the H I galaxies. The two white plus markers indicate the position of the X-ray emission over which the cluster is centred and the location near which the 3C129-A group lies and the orange stars are positions of the two radio sources, 3C129 and 3C129.1.
Current usage metrics show cumulative count of Article Views (full-text article views including HTML views, PDF and ePub downloads, according to the available data) and Abstracts Views on Vision4Press platform.
Data correspond to usage on the plateform after 2015. The current usage metrics is available 48-96 hours after online publication and is updated daily on week days.
Initial download of the metrics may take a while.