Fig. 12.
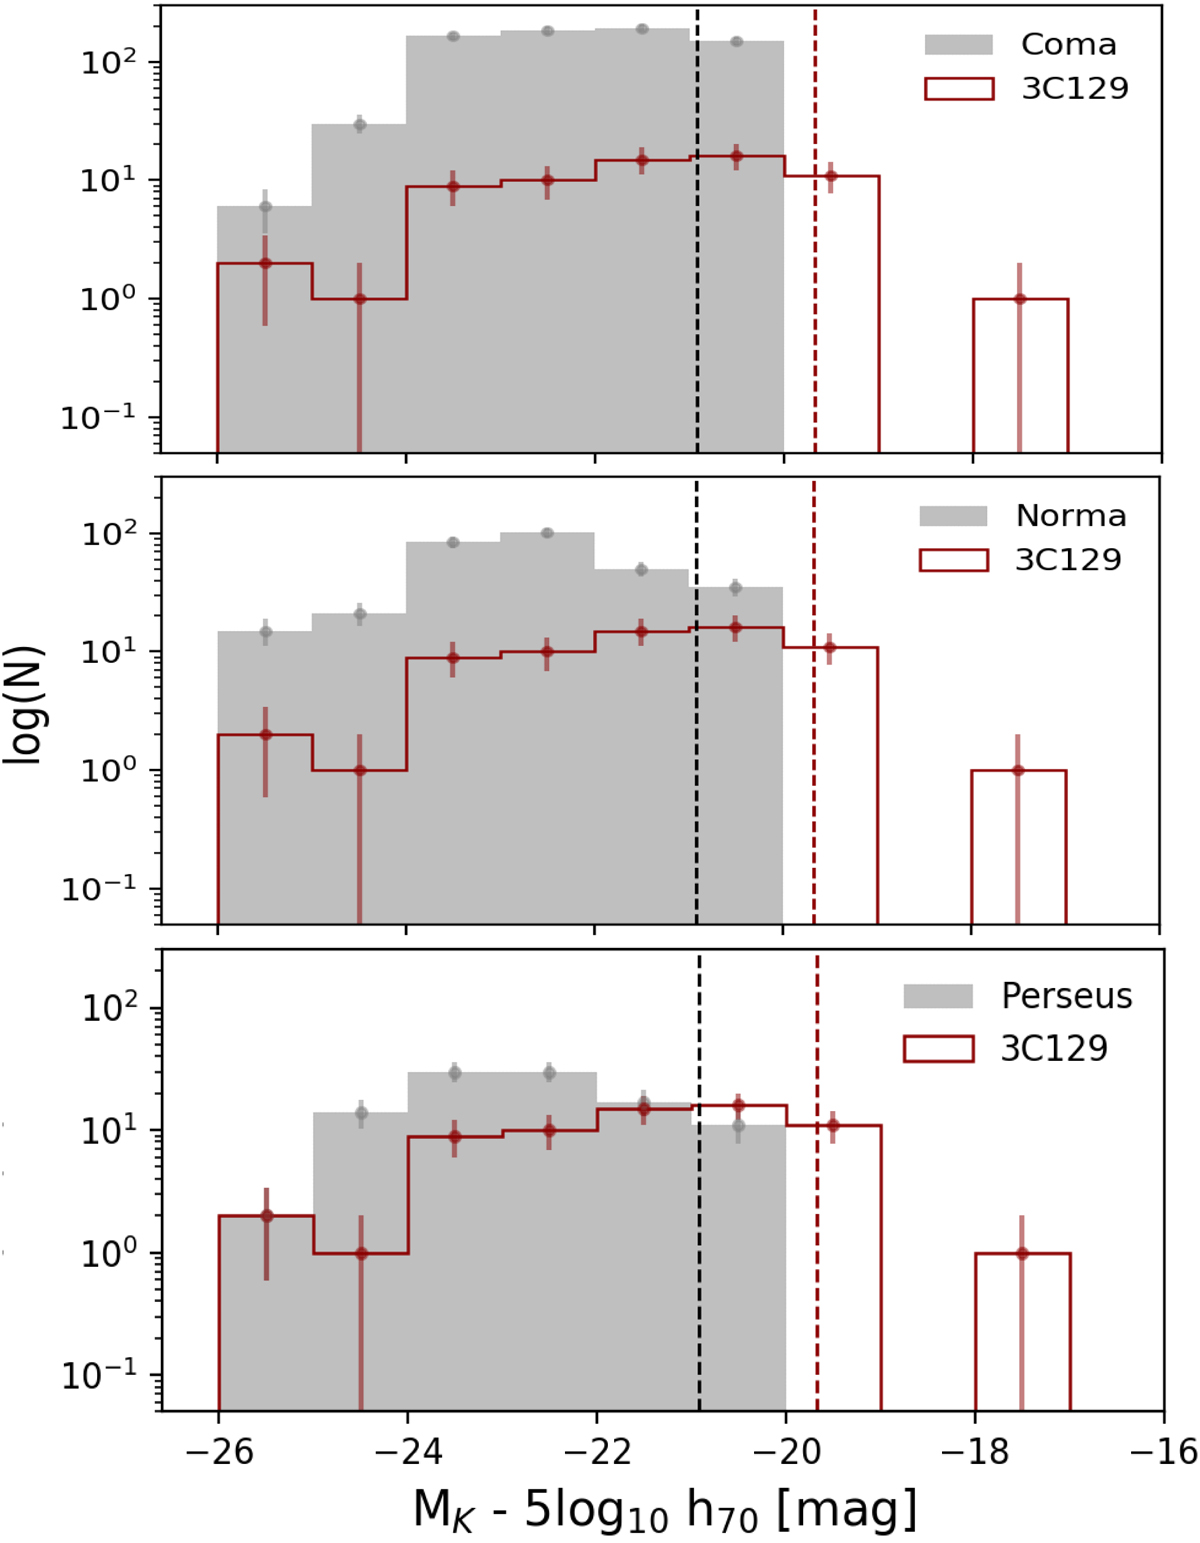
Comparison of the extinction corrected K-band magnitude distribution (with Poisson error bars) per 1.0 mag bin of the 3C 129 cluster (red) with three well known clusters at similar distances, the Coma and Norma and Perseus clusters indicated by the solid histograms. The solid black and red lines are the respective 2MASX and 3C129 UKIDSS sample completeness limits.
Current usage metrics show cumulative count of Article Views (full-text article views including HTML views, PDF and ePub downloads, according to the available data) and Abstracts Views on Vision4Press platform.
Data correspond to usage on the plateform after 2015. The current usage metrics is available 48-96 hours after online publication and is updated daily on week days.
Initial download of the metrics may take a while.