Fig. 11.
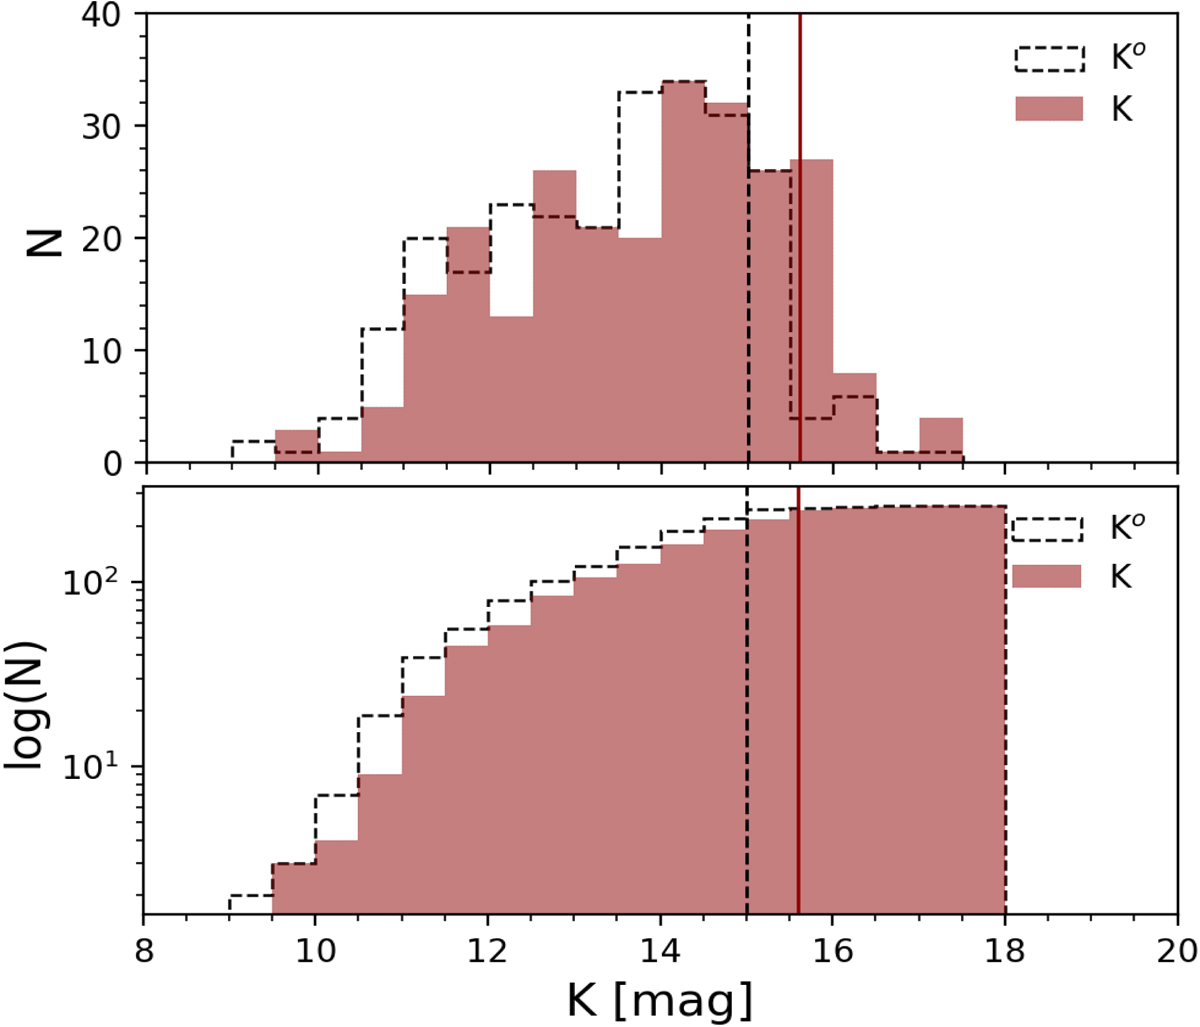
Top panel: histogram of the fiducial isophotal magnitudes for the K-band plotted in 0.5 magnitude bins. Bottom panel: cumulative galaxy number count distribution as a function of the K-band magnitudes. In both panels the solid and dashed distributions represents the observed and extinction-corrected magnitudes, respectively. The estimated completeness magnitude limit is shown by the red vertical line for the observed magnitudes and dashed vertical line for the extinction corrected magnitudes.
Current usage metrics show cumulative count of Article Views (full-text article views including HTML views, PDF and ePub downloads, according to the available data) and Abstracts Views on Vision4Press platform.
Data correspond to usage on the plateform after 2015. The current usage metrics is available 48-96 hours after online publication and is updated daily on week days.
Initial download of the metrics may take a while.