Fig. 10.
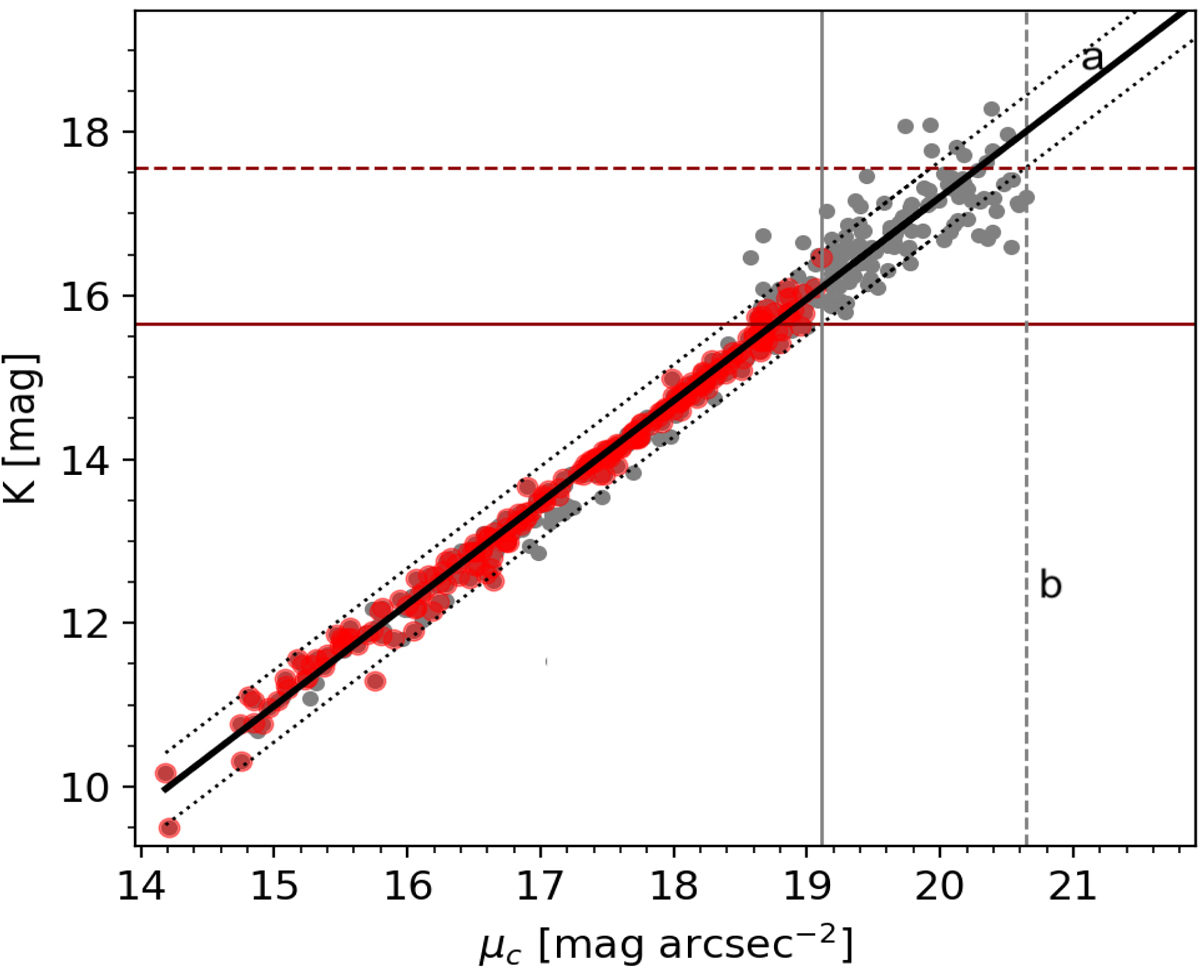
Estimation of the galaxy magnitude completeness limit. The grey points are all galaxies on red sequence in the cluster radius. Red points are those with rK20 > 3″ (that is, the cluster sample). Line a is the relation fitted through the grey points with the 1σ and −1σ deviation shown by the grey dotted lines. The surface brightness threshold for all 3C 129 galaxies on the red sequence is illustrated by line b. The completeness limit is given by the intercept of line b and the −1σ line. The corresponding surface brightness threshold and completeness limit lines for the bonafide cluster sample with rK20 > 3″ are denoted by the solid grey vertical and red line, respectively.
Current usage metrics show cumulative count of Article Views (full-text article views including HTML views, PDF and ePub downloads, according to the available data) and Abstracts Views on Vision4Press platform.
Data correspond to usage on the plateform after 2015. The current usage metrics is available 48-96 hours after online publication and is updated daily on week days.
Initial download of the metrics may take a while.