Fig. 3
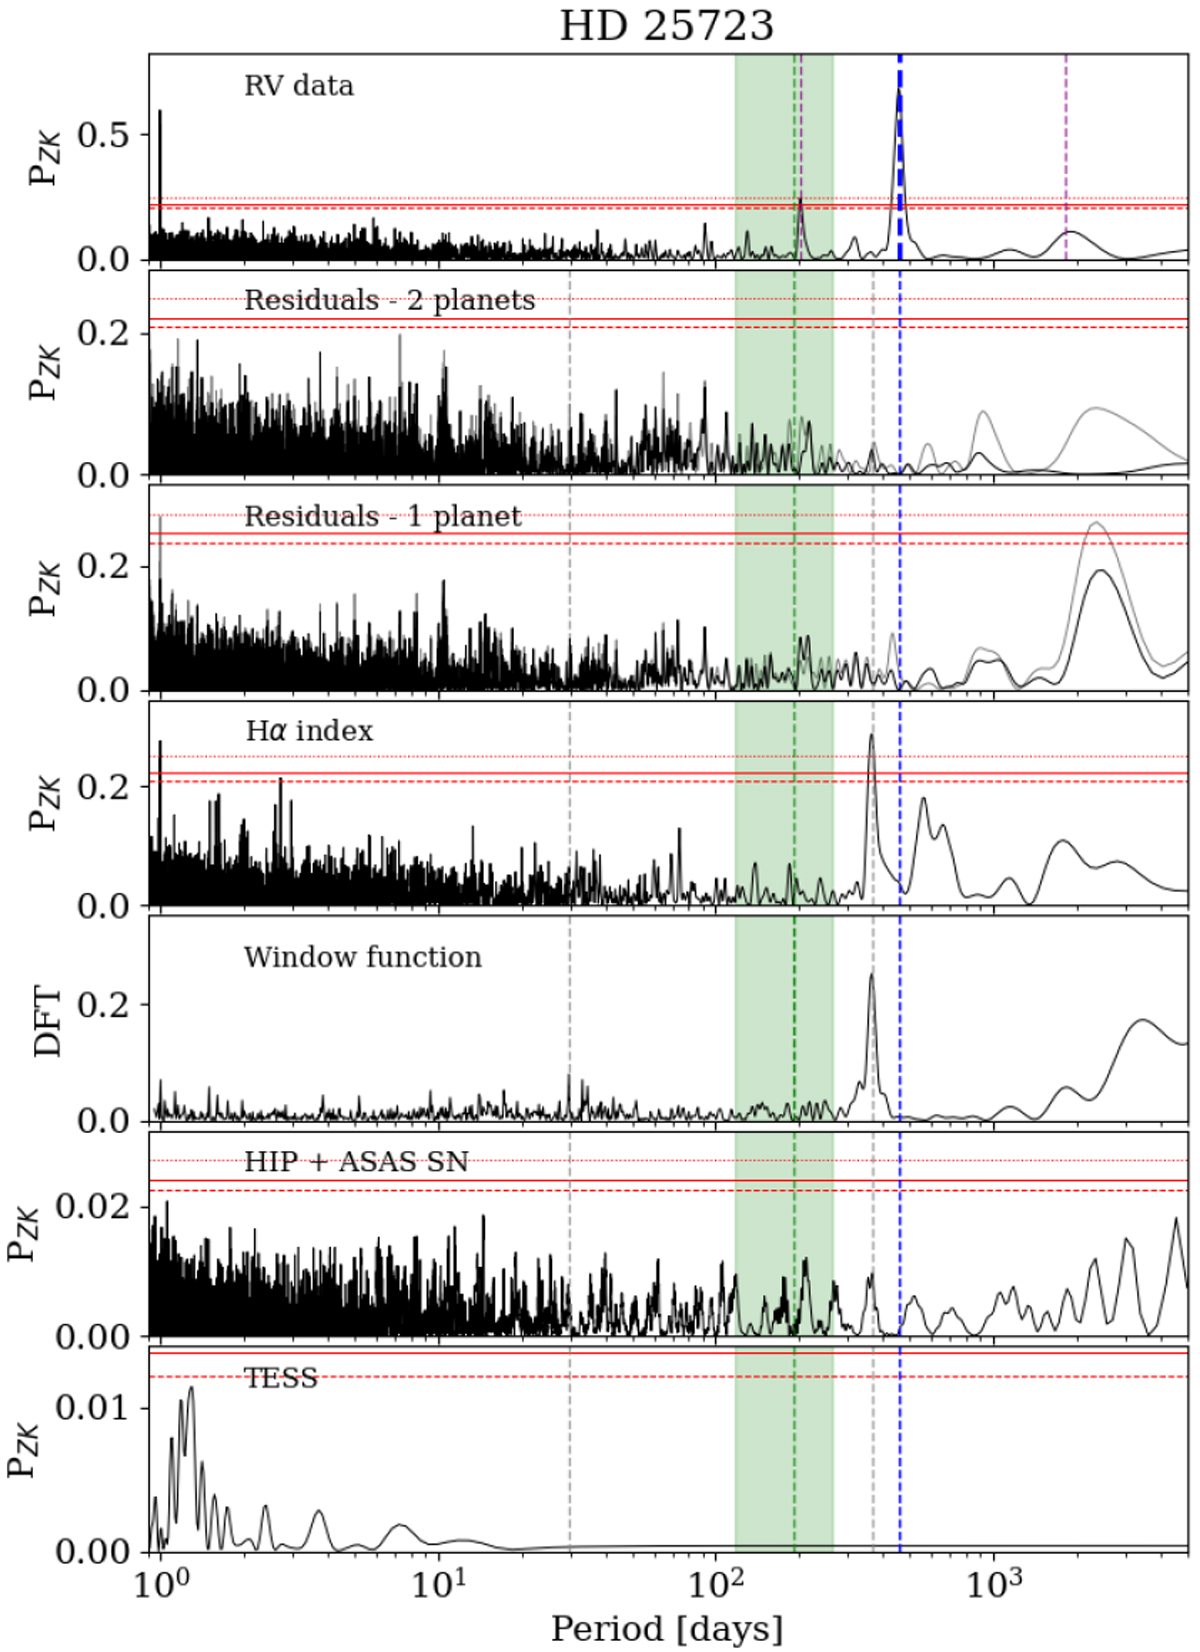
GLS periodograms for HD 25723 of RV data, residuals after subtraction of the best fit, Hα index, window function, HIPPARCOS, and ASAS SN V -band and TESS photometry. The blue dashed line corresponds to the orbital period of the planet. The green dashed line corresponds to the upper limit of the stellar rotation period. The green area shows the minimum and maximum value that the upper limit of the stellar rotation period can have, given its uncertainty. The gray vertical dashed lines correspond to one month (29.53 d) and one year (365.25 d) periods. The purple dashed lines in the RV data GLS show the yearly aliases of the main peak. The horizontal red lines show the 10%, 5% and 1% FAP levels. The gray line in the residuals of the two Keplerian solution shows the residual GLS of one Keplerian plus linear trend solution. The gray line in the residual GLS of the one Keplerian solution shows the residuals GLS of one Keplerian solution modeled with the orbital parameters of the double-Keplerian solution.
Current usage metrics show cumulative count of Article Views (full-text article views including HTML views, PDF and ePub downloads, according to the available data) and Abstracts Views on Vision4Press platform.
Data correspond to usage on the plateform after 2015. The current usage metrics is available 48-96 hours after online publication and is updated daily on week days.
Initial download of the metrics may take a while.