Fig. 16
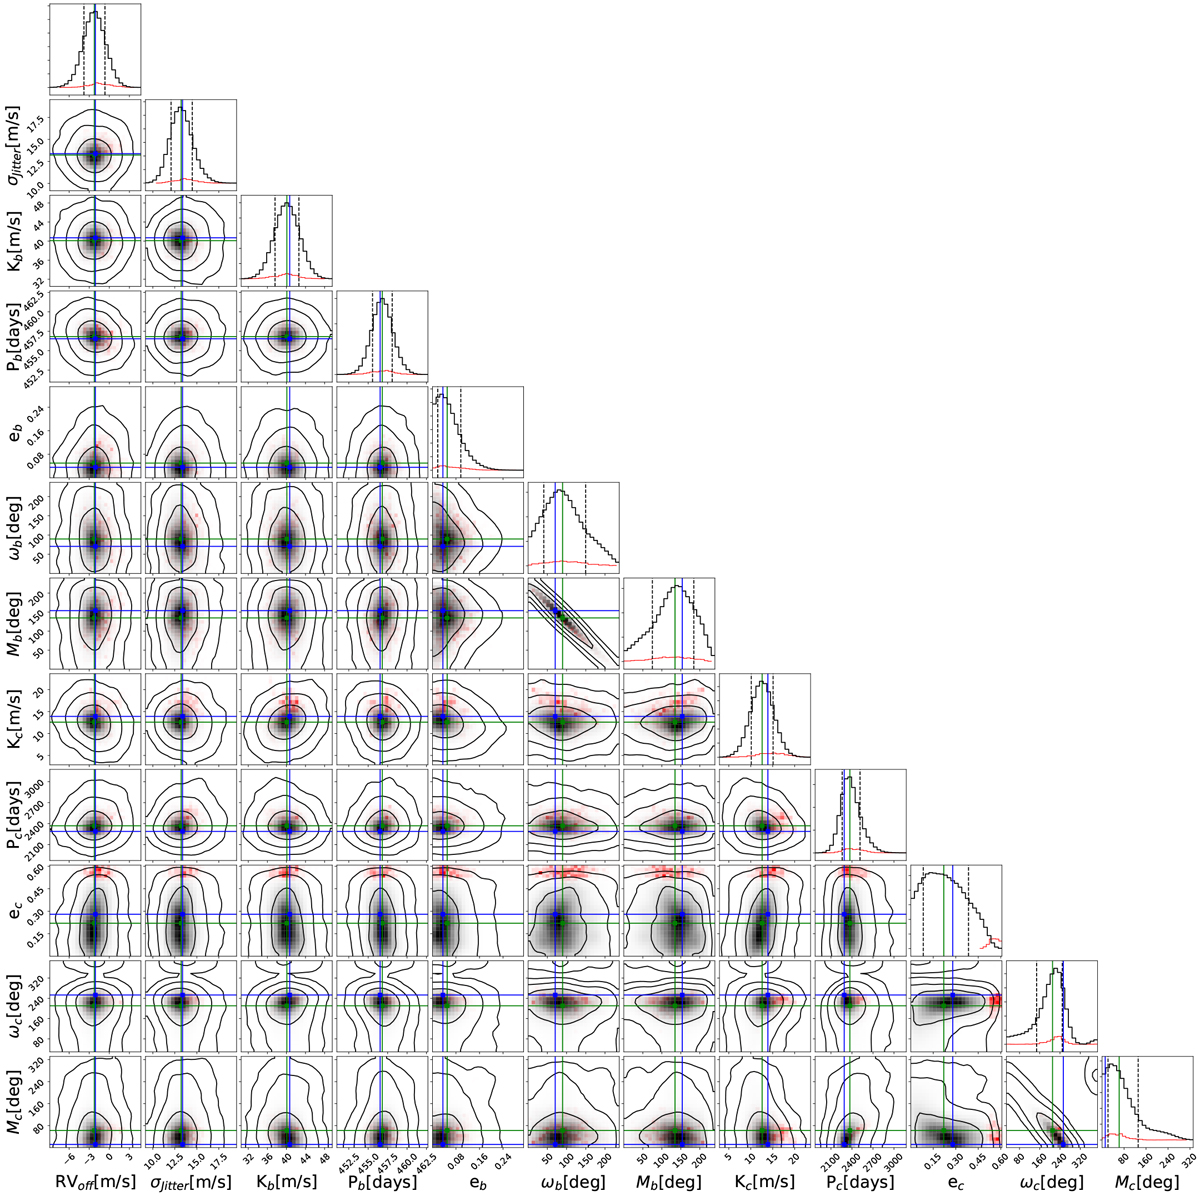
Posterior distributions HD 25723 system orbital parameters. Each panel contains ~50 000 samples that are tested for 100 kyr dynamical stability using the MVS integrator. Stable samples are plotted in black, while non-stable samples are plotted in red. The upper panels show the probability density distribution of each orbital parameter of the stable samples (black) and of the non-stable samples (red). Contours indicate the 68.3%, 95%, and 99.7% confidence interval levels (i.e., 1σ, 2σ, and 3σ). The blue and green cross indicate the dynamical best-fit solution and the stable solution, respectively.
Current usage metrics show cumulative count of Article Views (full-text article views including HTML views, PDF and ePub downloads, according to the available data) and Abstracts Views on Vision4Press platform.
Data correspond to usage on the plateform after 2015. The current usage metrics is available 48-96 hours after online publication and is updated daily on week days.
Initial download of the metrics may take a while.