Fig. A.1.
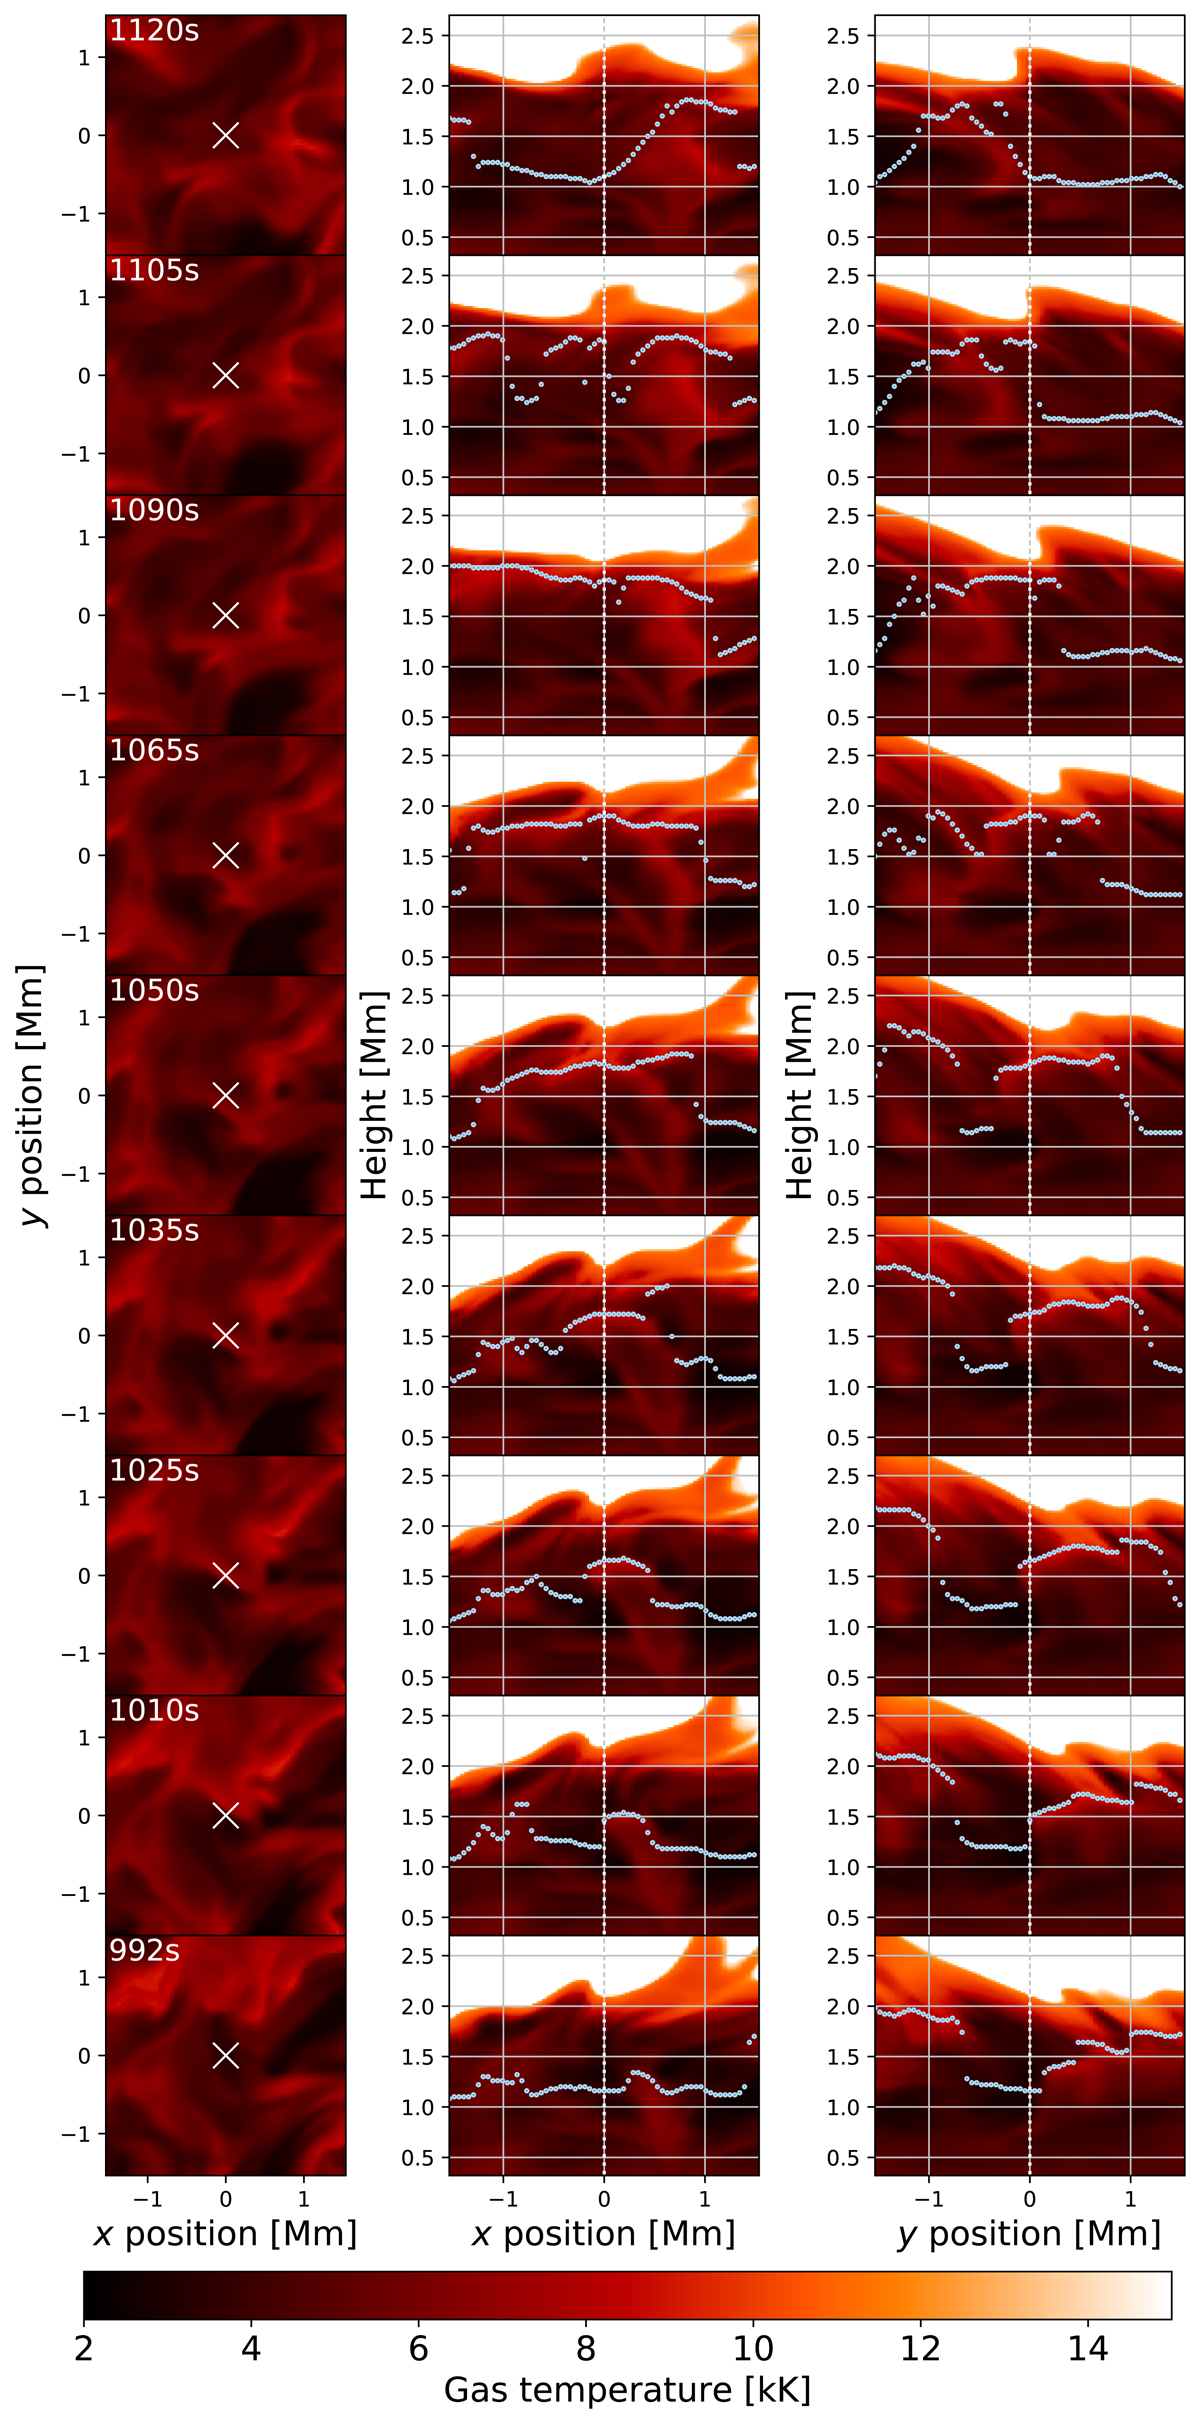
Illustration of a propagating shock wave in the Bifrost 3D simulation. Gas temperature surrounding the shock wave example is shown at nine time steps between t = 992 s and t = 1120 s of the simulation run. The leftmost column shows horizontal cuts (top-view) at a height of z = 1.5 Mm, and the middle and rightmost columns show vertical cuts with the height versus the x- and y-coordinates, respectively. The blue markers show the formation height of unity optical depth τ = 1.0 for the mm wavelenghts of ALMA band 3 (2.78 − 3.26 mm). The white crosses and the vertical white dashed line at (x, y) = (0, 0) mark the location of the sampled Tb signature in Fig. 12c. At t = 992 s the shock front is visible and the mm-wavelength intensities at τ = 1.0 are coupled with it at (x, y, z) = (0.3, 0.3, 1.2) Mm. The front is propagating mostly upwards and inwards towards (x, y, z) = (0, 0, 1.6) Mm at t = 1025 s. The Tb signature is peaking in magnitude at this location around t = 1050 s, when a cooler post-shock region is visible where the front has passed. The mm-wavelength intensities are tracking the shock front upwards to z ≈ 2.0 Mm around t = 1090 s and thereafter decouple and sample the post-shock region (t = 1120 s). See Eklund et al. (2020) for a more detailed analysis of propagating shock waves in the Bifrost simulation.
Current usage metrics show cumulative count of Article Views (full-text article views including HTML views, PDF and ePub downloads, according to the available data) and Abstracts Views on Vision4Press platform.
Data correspond to usage on the plateform after 2015. The current usage metrics is available 48-96 hours after online publication and is updated daily on week days.
Initial download of the metrics may take a while.