Fig. 4.
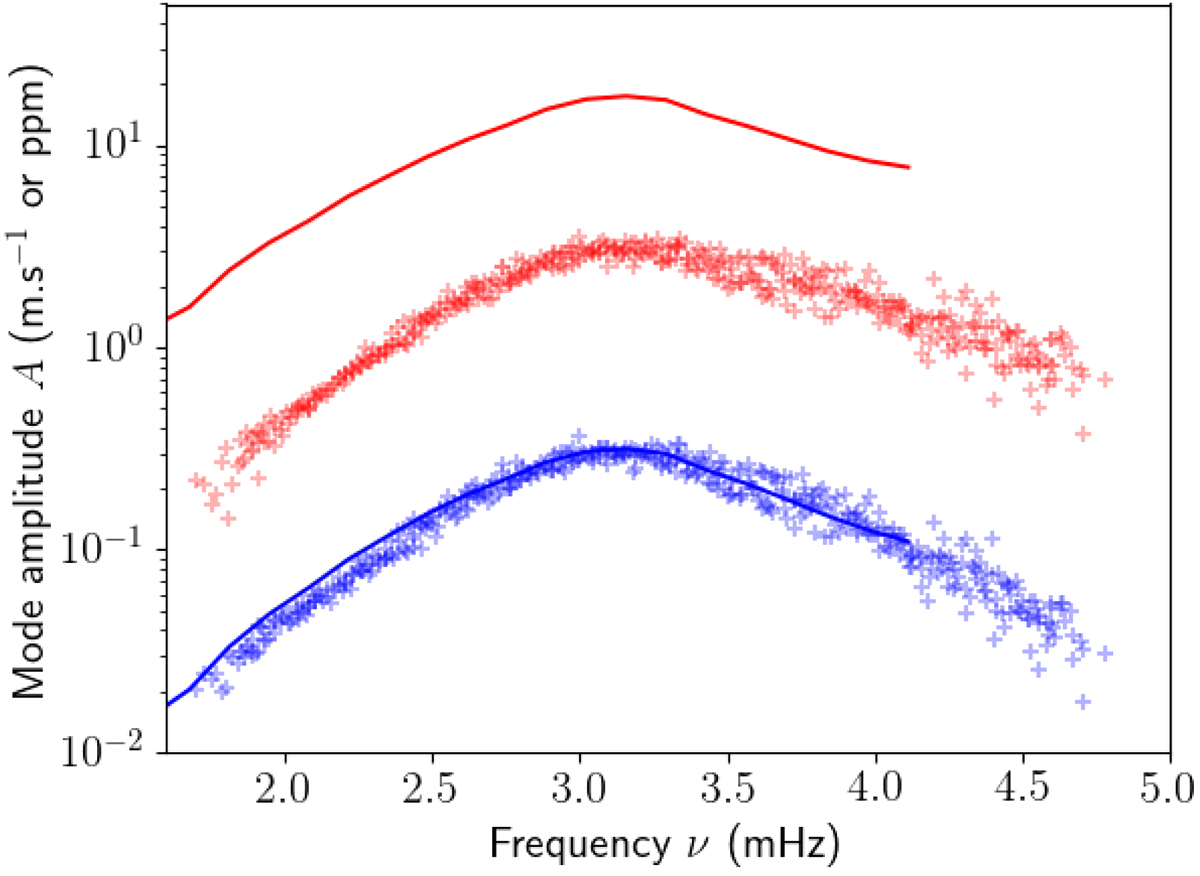
p-mode amplitudes A, as defined by Eq. (29), as a function of mode frequency ν. The legend is identical to that of Fig. 2: crosses correspond to amplitudes inferred from observations, using the spectral analysis of Barban et al. (2004) (each cross represents an individual doublet (n, l)), whereas solid lines correspond to the prediction of our model; blue element pertain to velocity, red elements to intensity. The amplitudes are given in m.s−1 for velocity, and in ppm for intensity.
Current usage metrics show cumulative count of Article Views (full-text article views including HTML views, PDF and ePub downloads, according to the available data) and Abstracts Views on Vision4Press platform.
Data correspond to usage on the plateform after 2015. The current usage metrics is available 48-96 hours after online publication and is updated daily on week days.
Initial download of the metrics may take a while.